Skip to content
Vorkast
  • Home
  • Blog
  • ChartExpand
    • Trading Chart
    • Quick Reference Chart
  • AnalysisExpand
    • Crypto
    • Forex Analysis
    • Precious Metal Analysis
    • Stock Analysis
0
Vorkast
Home / Analysis / Stocks Analysis / EURUSD/GBPUSD move off highs. Oil retracing declines. Yields now higher.

EURUSD/GBPUSD move off highs. Oil retracing declines. Yields now higher.

EURUSD/GBPUSD move off highs. Oil retracing declines. Yields now higher.

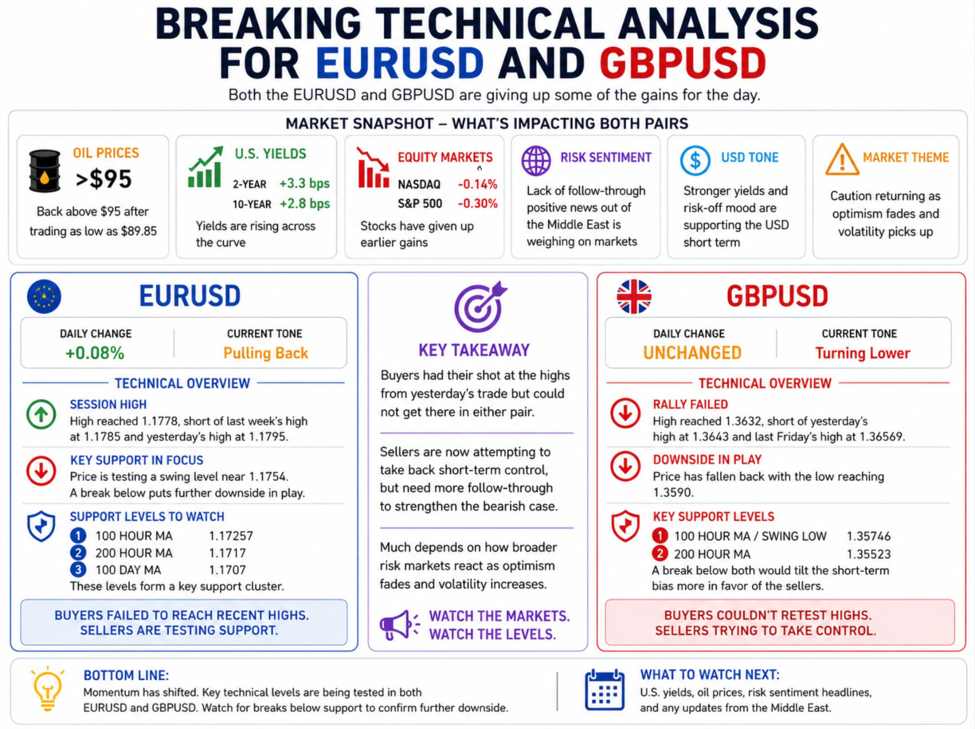
Both the EURUSD and GBPUSD are giving back earlier gains as broader market sentiment turns more cautious. The EURUSD is still modestly higher on the day by 0.08%, while the GBPUSD has slipped back to unchanged levels after failing to sustain upside momentum. Meanwhile, crude oil has rebounded sharply back above $95 after earlier trading as low as $89.85, helping push U.S. yields higher, with the 2-year yield up 3.3 basis points and the 10-year yield up 2.8 basis points. Equity markets have also softened, with the Nasdaq now down -0.14% and the S&P 500 lower by -0.30%, as traders reassess the lack of meaningful follow-through positive headlines out of the Middle East.

Technically, the EURUSD has rotated lower after stalling just below key resistance levels. The pair reached a session high near 1.1778, falling short of last week’s high at 1.1785 and yesterday’s peak at 1.1795. The failure to extend higher has encouraged sellers, with the pair now testing an important swing level near 1.1754. A break below that support would shift attention toward the 100-hour moving average at 1.17257, followed by the 200-hour moving average at 1.1717 and the 100-day moving average at 1.1707. Those levels represent an increasingly important support cluster that buyers will need to defend to maintain the broader bullish bias.

The GBPUSD is showing a similar technical pattern. Buyers attempted another push higher, but momentum stalled well ahead of yesterday’s high at 1.3643 and last Friday’s high at 1.36569. Today’s rally topped out at 1.3632 before sellers regained control and pushed the pair back lower. The low has now reached 1.3590, bringing the pair closer to a key support target near the 100-hour moving average and the low end of a swing area at 1.35746. A move below that level would open the door for a deeper correction toward the 200-hour moving average at 1.35523. A break beneath both hourly moving averages would tilt the short-term technical bias more firmly in favor of the sellers.

In short, buyers had their opportunity to extend the bullish momentum in both pairs but failed to retest recent highs. Sellers are now trying to seize back short-term control, although they still need additional downside follow-through to strengthen the bearish case. Much may depend on how broader risk markets continue to react as optimism surrounding Middle East developments begins to fade.

Recent Posts

  • 360 Energy Pulse: What mattered this month in energy
    360 Energy Pulse: What mattered this month in energy
  • Why rising interest rates haven’t crushed stock valuations
    Why rising interest rates haven’t crushed stock valuations
  • May rewired global energy markets
    May rewired global energy markets
  • Stablecoin demand may soon fade, BoE’s Greene says
    Stablecoin demand may soon fade, BoE’s Greene says
  • Market concentration is creating ‘fragility’: Only 60% of S&P 500 stocks are above their 200-day average
    Market concentration is creating ‘fragility’: Only 60% of S&P 500 stocks are above their 200-day average

Recent Comments

No comments to show.

Category

  • Analysis
  • Commodity & Future News
  • Commodity Analysis
  • Crypto Analysis
  • Cryptocurrency News
  • Forex Analysis
  • Forex News
  • News
  • Stocks Analysis
  • Stocks News

Tags

Disclaimer

Financial market trading has large potential rewards, but also large potential risks. You must be aware of the risks and be willing to accept them to invest in the financial markets. Nothing on our website shall be deemed a solicitation to buy or sell; it is up to the trader to take that information and determine his or her trading strategy.

Account

  • Edit Account
  • My Account
  • My Cart
  • My Orders
  • Wishlist

Policies

  • Privacy Policy
  • Return Policy
  • Terms of Use
  • Cookies
  • Disclaimer

© 2026 Vorkast. All Rights are Reserverd

We care about your privacy

In order to provide you a personalized shopping experience, our site uses cookies. By continuing to use this site, you are agreeing to ourĀ cookie policy.

Ask a question

Share


Lost your password?


Don't have an account yet? Sign up

Shopping Cart

Your cart is empty

No items in your cart. Go on, fill it up with something you love!

Start Shopping Now
Select the fields to be shown. Others will be hidden. Drag and drop to rearrange the order.
  • Image
  • SKU
  • Rating
  • Price
  • Stock
  • Availability
  • Add to cart
  • Description
  • Content
  • Weight
  • Dimensions
  • Additional information
Click outside to hide the comparison bar
Compare
Scroll to top
  • Home
  • Blog
  • Chart
    • Trading Chart
    • Quick Reference Chart
  • Analysis
    • Crypto
    • Forex Analysis
    • Precious Metal Analysis
    • Stock Analysis
Search