
Six companies on earth are designing custom AI chips at hyperscale.
Google. Meta. OpenAI. Anthropic. Apple. And one customer Broadcom hasn’t publicly named.
None of them is doing it alone.
The same designer is behind every one of them. It controls more than 70% of the custom AI silicon market.
Broadcom.
Google’s TPUs. Meta’s MTIA chips. OpenAI’s first Titan chip deploying in 2027. The new gigawatts of compute Anthropic is bringing online. Broadcom designs the silicon, handles the advanced packaging, and supplies the high-speed networking that ties the racks together.
Anthropic is scaling from one gigawatt of compute in 2026 to three gigawatts in 2027. OpenAI’s first-generation Broadcom-designed chip deploys in volume in 2027 at over a gigawatt.
Meta is targeting multiple gigawatts of MTIA capacity by the same year. Google’s TPU agreement with Broadcom runs through 2031.
The custom AI silicon market sits at roughly $20 billion today. It heads to $60 billion by 2026. Hock Tan, AVGO’s CEO, told the Street he expects AI chip revenue alone to top $100 billion by 2027.
That number is backed by a $73 billion committed customer backlog already signed.
Broadcom (AVGO) is the cleanest pure-play in the world on the custom AI silicon arms race.
AVGO is the dominant designer of custom AI accelerators paired with the networking equipment that connects every major AI cluster.
No legacy semiconductor drag, no consumer cyclicality, no diversified segments to dilute the math. The closest thing to a one-decision name in the entire AI infrastructure stack.
The Q1 numbers prove the setup. AVGO reported earnings on March 4 with record revenue of $19.3 billion, up 29% year over year.
AI revenue alone hit $8.4 billion, up 106% from the prior year and ahead of the company’s own forecast. Adjusted EBITDA came in at $13.1 billion (68% of revenue), and free cash flow was $8 billion.
Q2 guidance is approximately $22 billion in total revenue with $10.7 billion of it from AI. That’s roughly $42 billion of AI revenue annualized, and it’s still ramping.
The company also authorized a new $10 billion share buyback program on the same call. Q1 alone returned $10.9 billion to shareholders, with $7.8 billion in repurchases and the rest in dividends.
Today, AVGO ripped 5.52% to close at $439.79 on above-average volume. The Street’s 12-month average target sits north of $470, with Jefferies at $500.
I don’t have a position yet.
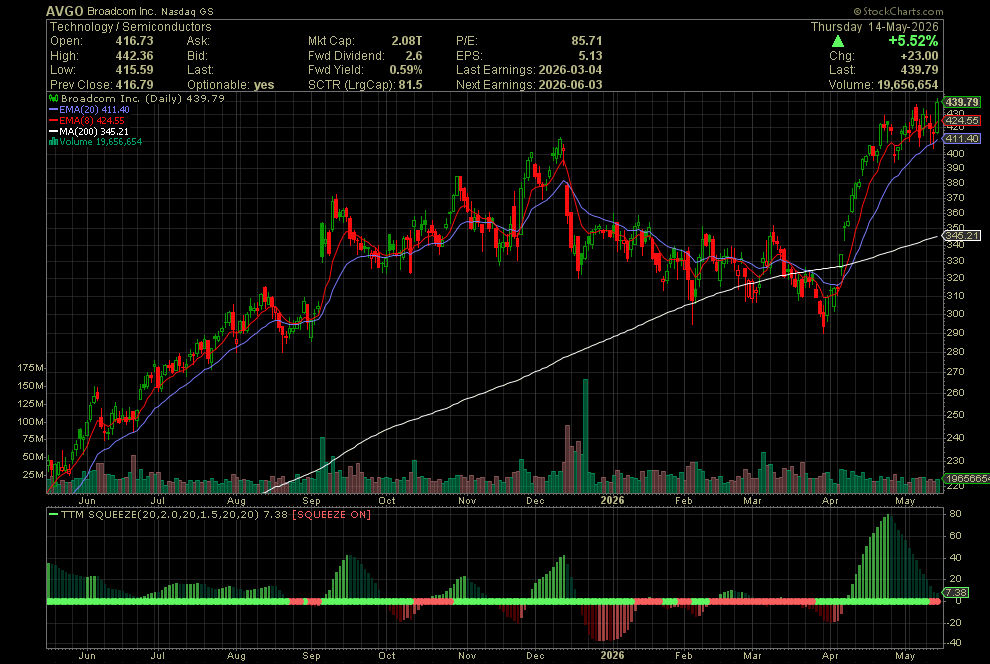
But the chart’s doing exactly what I look for in a momentum setup.
AVGO is in a bullish stacked-EMA setup on the daily and weekly timeframes. The 8 EMA at $424.55 is above the 20 EMA at $411.40, both well above the 200 SMA at $345.21, and all three are sloping up.
Underneath that price action, a daily squeeze is forming.
When a squeeze sets up on a name that’s already trending higher with stacked EMAs and a confirmed fundamental tailwind, that’s the cleanest version of my TPS framework: trend, pattern, squeeze.
I find that squeezes on stocks near highs tend to have explosive reactions.
Your Action Plan
AVGO is on the watchlist because the structure is exactly what I hunt for every week.
The fundamentals do the heavy lifting. AVGO sits on 70% market share in custom AI chip design with $73 billion of committed backlog and AI revenue growing more than 100% year over year. Management just authorized another $10 billion in buybacks on top of the $7.8 billion already used in Q1.
The chart confirms it. Stacked EMAs on two timeframes, fresh momentum off the April low, and a daily squeeze building right under price.
Setups like this don’t sit around forever. The work is identifying them before they move, not chasing them after.
Yesterday I closed out at 250% winner in NBIS, 50% winner in NVTS, 33% winner in TWLO, 90% winner in AIRS, 50% gains in COST, and 30% in BW. If you want to know what I’m trading today, check out Daily Profits Live.