
Most biotechs burn cash and beg for more. This one is printing it.
Liquidia (LQDA) spent years as a classic biotech lottery ticket. One drug, one FDA decision, a lawsuit hanging over the whole thing. You either guessed right, or you got cut in half.
That is the kind of name I usually watch from a safe distance.
Then it flipped. Their inhaled lung-disease drug, Yutrepia, got full FDA approval, and the launch took off faster than almost anyone modeled. Last quarter, the company did about $130 million in sales and booked real net income.
That was its third straight profitable quarter. A biotech this size making money instead of bleeding is rare, and the market noticed.
The lawsuit was the other shadow on this stock, and it just got smaller. A competitor had been trying to get a court to block Yutrepia.
At the end of May, a judge shot down their request for an injunction. The threat is not gone for good, but the biggest near-term roadblock just got cleared, and that is why this thing has been pressing higher.
That is the story.
But the story is not what put it on my watchlist. The chart did.
So let me walk you through it the way I look at every setup, in order, trend first.
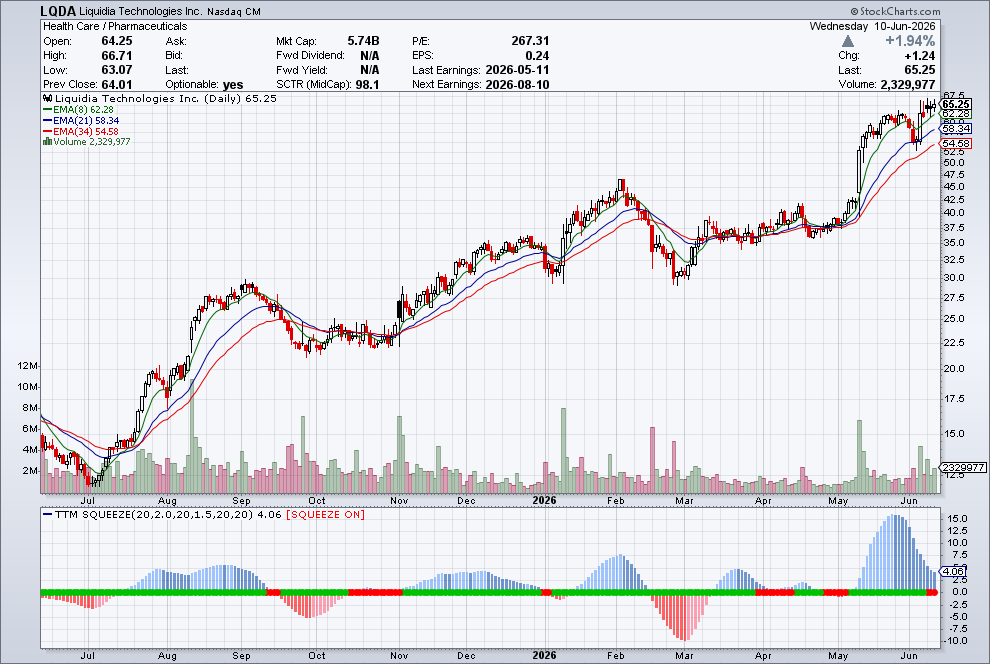
Start with the trend, because if the trend is wrong, nothing else matters.
LQDA has been climbing for the better part of a year, higher highs and higher lows, the steady staircase that tells you buyers keep stepping in on every dip.
If you have never before looked at a chart in your life and saw this, you would know instantly that the trend is sloping upwards. That’s how you know it’s a strong trend.
Then the pattern, and this is where I start leaning in. Look at the moving averages. The 8-day is on top, the 21-day right beneath it, the 34-day beneath that, every one of them rising, with price riding above the whole stack.
It means the trader who bought last week, the one who bought last month, and the one who bought months ago are all in the green together. Nobody is trapped overhead waiting to dump shares into the first sign of strength.
When the averages fan out in that order, the trend has real fuel under it instead of running on fumes.
Lastly, the squeeze is on.
A squeeze occurs when a stock stops making big swings and cools into a tighter and tighter range.
Picture a spring being slowly compressed. Volatility winds down, the range pinches in, and all that energy gets stored with nowhere to go yet. The longer it coils, the harder it tends to pop when it finally releases.
On the bottom of the chart that shows up as the squeeze dots firing on, and right now they are on. This thing is wound up tight.
Here is what makes this squeeze the good kind. It is coiling right up near the highs, not down in the gutter after a beating.
A spring loading up at the top of a strong uptrend is the most bullish place it can be, because the path of least resistance is already up and the coil is just packing fuel in that same direction.
Combine it all, and that’s the trend, pattern, and squeeze all lining up on one chart, and that is the exact setup I want to be ready for every time.
Your Action Plan
It’s been a tricky and volatile market of late. Being selective and patient is key. You want to avoid trading marginal setups. But this isn’t one of them.
I share my full daily watchlist with the Daily Profits Live members. And find setups like these in the live trading room. If you want to start trading with us, click here to learn more.