
Gold Market Early Weekly Observation: Rebound Continues, Underlying Concerns Remain – In-Depth Technical Analysis of Gold
On Monday (July 6th) in early Asian trading, international gold opened slightly higher at $4181.11 per ounce, subsequently maintaining a narrow range with a slightly upward bias. The weekend news was relatively quiet, but the Iranian parliament speaker’s signal of a possible US-Iran consensus undoubtedly weakened the potential for geopolitical premiums, while also putting pressure on oil prices and cooling inflation expectations – which in turn provided a layer of implicit safe-haven support for gold prices. In the short term, I believe gold prices still have room to continue their rebound, but the pace and strength warrant careful consideration.
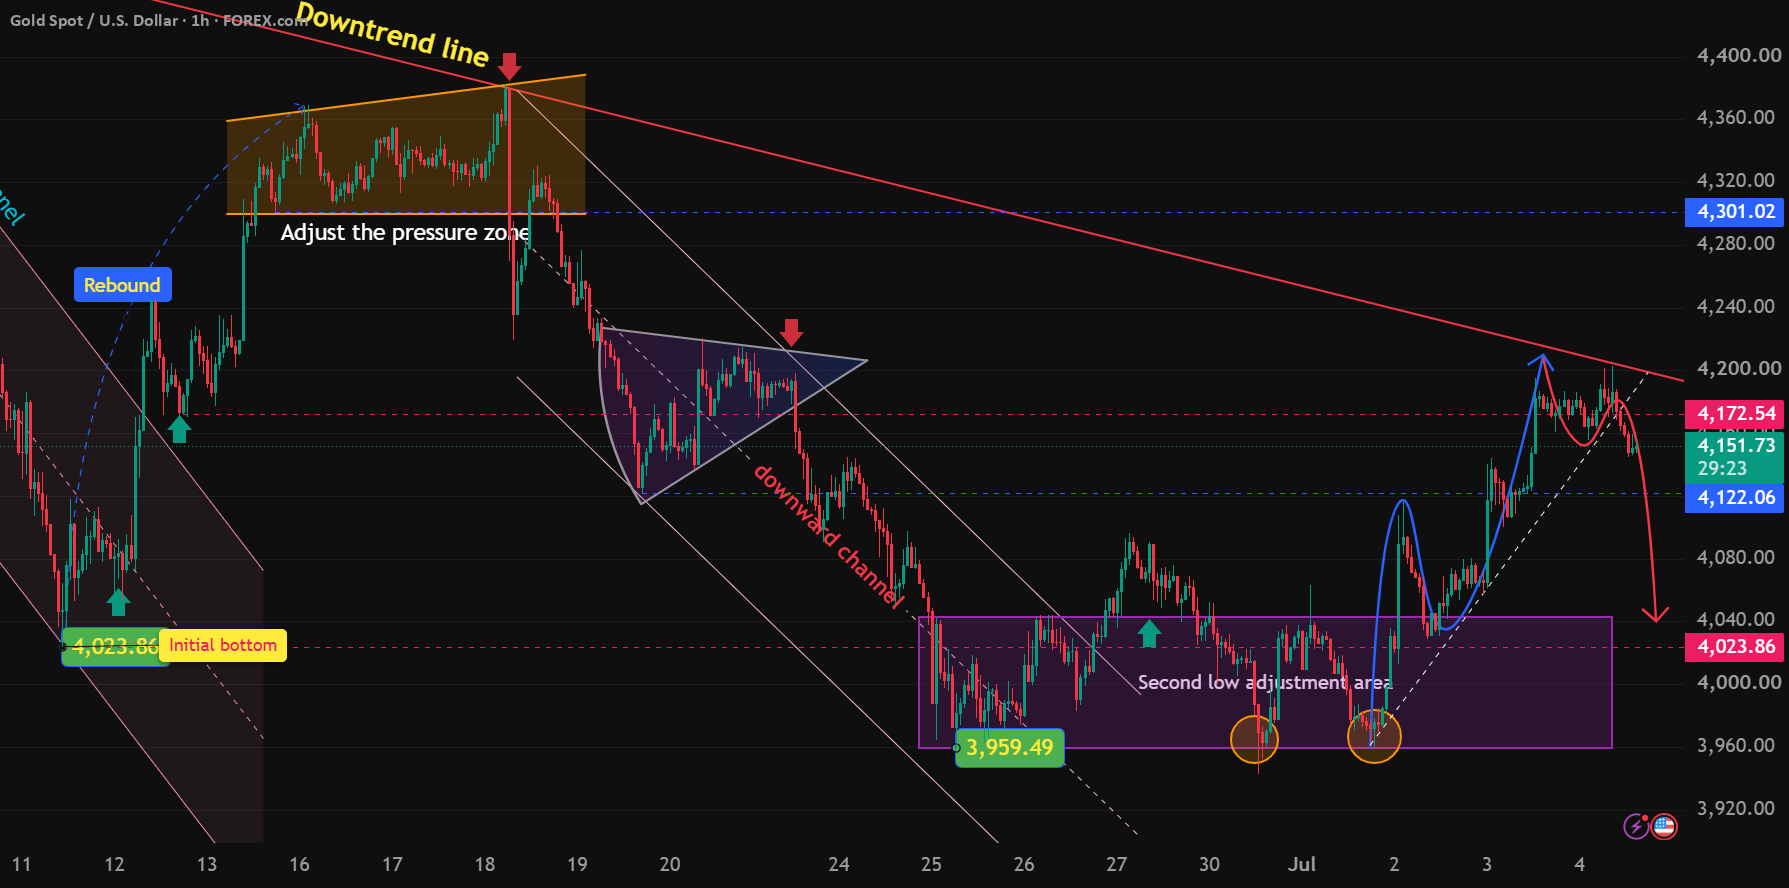
Last Week’s Review: The Unexpectedly Cool Non-Farm Payrolls Data Provided an Excuse for the Rebound 📉 Last Thursday and Friday, gold closed higher for two consecutive days, rising above the 20-day moving average ($4150). The trigger was undoubtedly the weaker-than-expected June non-farm payroll data, which slightly cooled market expectations for a Fed rate hike 🌡️. However, frankly, I prefer to characterize this rise as a technical oversold rebound – gold prices had previously slid from above $4370 to around $4000 with almost no significant correction, technical indicators were severely oversold, and the bullish demand for a rebound far outweighed any improvement in fundamentals 🔥.
I have repeatedly emphasized the crucial importance of the $4000 support level in my previous strategies 💡. Last week, the market did find buying support at this level, but a closer look at the body of the rebounding candles and the accompanying volume reveals that the momentum was not particularly strong. In other words, this was more like a temporary reprieve than a decisive victory 🎺. This Week’s Outlook: How Far Can the Rebound Go? Two Key Areas 🗺️ Entering this week, I believe it’s crucial to clarify the following points:
First, the rebound isn’t over, but its upside is likely limited 📏.
The daily moving average system hasn’t yet formed a bullish crossover. While short-term moving averages (5-day, 10-day) are turning upwards, medium-term moving averages (30-day, 60-day) are still exerting downward pressure. This structure typically indicates the rebound will unfold as a “gradual climb” rather than a “one-sided surge” 📈. Initial resistance is concentrated in the $4200-$4220 area. A successful break above this level would offer a chance to challenge the previous high of $4370/$4380—but I personally hold a conservative view, considering the probability low 🤔.
Second, be wary of a pullback to confirm support at the beginning of the week 🔙.
After last week’s sharp rise, short-term profit-taking has accumulated, and indicators are entering overbought territory. A pullback to test the support level of the moving averages below is possible at the beginning of the week ⚠️. Key levels to watch are $4150-$4140 (around the 20-day moving average) and the lower $4115-$4100 area. If prices unexpectedly fall back below $4000 this week, this rebound will be aborted, so please be extremely cautious.
Today’s Data and Trading Strategy 📊 Today, pay attention to the final reading of the US June S&P Global Services PMI, the ISM Non-Manufacturing PMI, and the Global Supply Chain Stress Index. 📰 The overall market expectation is bullish for gold prices, but considering the recent large fluctuations due to “expectation discrepancies,” I suggest prioritizing technical levels and using data as a secondary factor for decision-making. 🎯
Specific strategies are as follows:
Short-term short position strategy ⬇️: Consider a small short position around $4170-$4180, with a stop-loss above $4210, targeting the $4140-$4150 area. This trade is based on a technical pullback to the resistance zone, not a trend-driven bearish outlook.
Wait for the right opportunity to enter long positions: If gold prices retrace to the $4115-$4120 range and a clear bottoming signal appears (such as a hammer candlestick pattern on the hourly chart, a volume-driven rebound, etc.), then consider entering a short-term long position based on the actual market conditions. Before that, don’t rush to buy the dip.
💭After so many years of trading, I’ve come to a profound realization: rallies are the most tempting, but also the most damaging. 😵💫 It’s like the afterglow of sunset 🌅, dazzling yet fleeting, tempting you to chase, but easily leading to being swallowed by the darkness 🌚. Gold is currently at such a delicate juncture—it has risen, but confidence is not solid. Instead of betting on direction, it’s better to wait for the right rhythm.
If you also agree with the strategy of “first observe the consolidation, then look for a breakout,” try to be more patient and less impulsive in actual trading. 🧘 Of course, the market is never short of surprises, and I will adjust my judgments based on real-time market movements. 🔄 If you found the analysis helpful, don’t forget to like and support it! 👍 Feel free to share your different opinions or trading experiences in the comments section 💬. Let’s refine our strategies and improve together 📚. This week’s market performance, let’s wait and see! 👀 🔥