
Market View
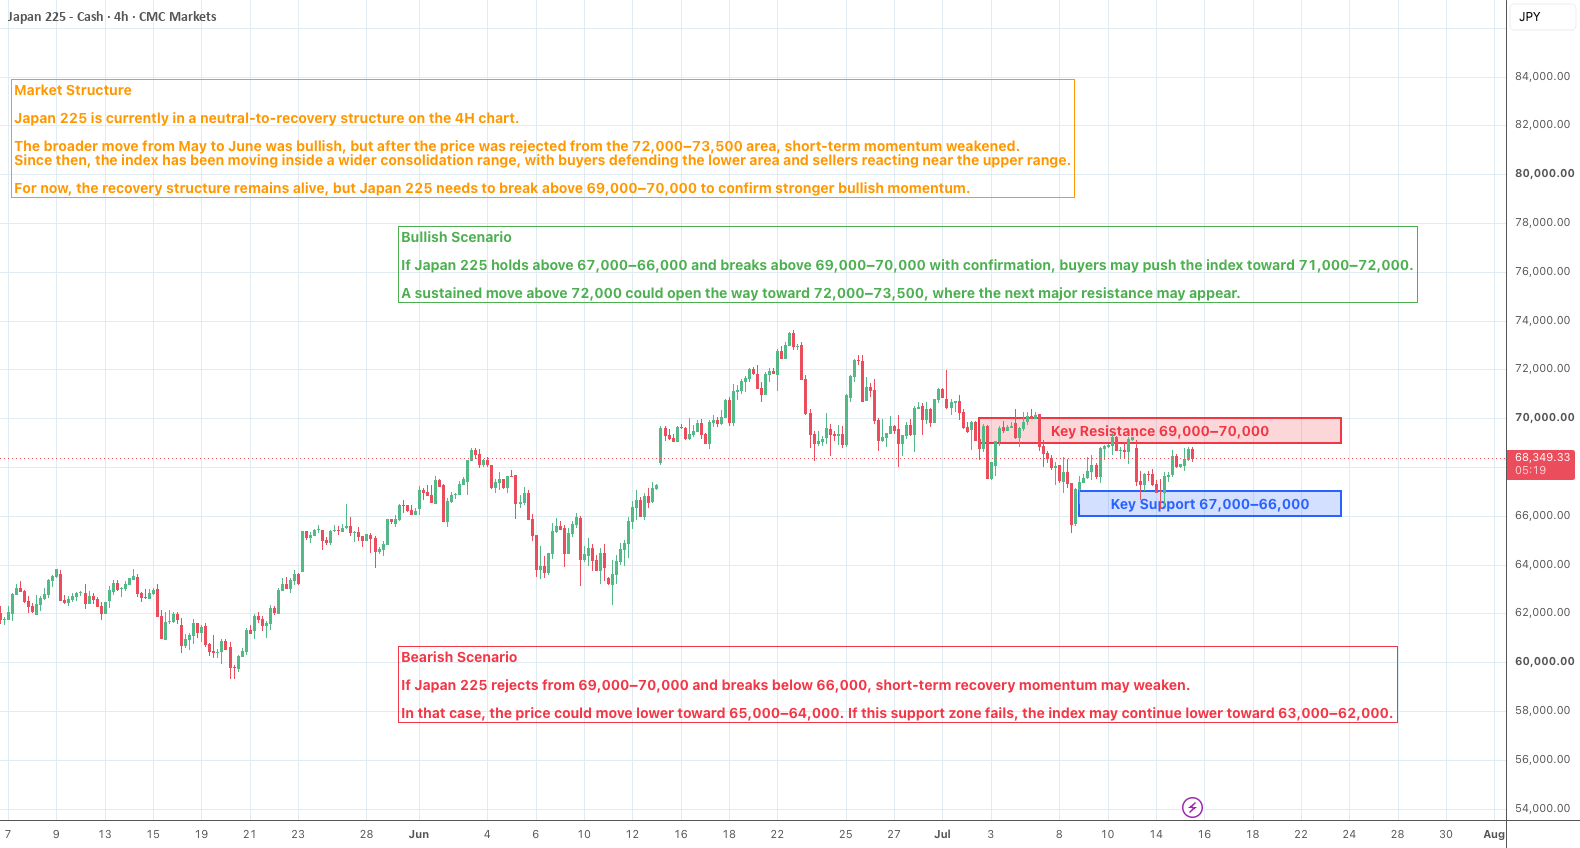
Japan 225 is currently trading around the 68,400–68,500 area on the 4H chart. After a strong rally into the 72,000–73,500 region, the index lost momentum and moved into a corrective range. Price has since been rotating between support around 66,000–67,000 and resistance near 69,000–70,000.
The latest price action shows that buyers are trying to stabilize the market after the recent pullback. However, the index has not yet broken above the upper side of the current range, so the recovery still needs confirmation.
Right now, Japan 225 is sitting in a key short-term decision area. If buyers can reclaim 69,000–70,000, the recovery may continue. If sellers defend this zone again, the price could remain trapped inside the current consolidation structure.
Key Areas
From a market structure perspective, Japan 225 is currently in a neutral-to-recovery structure on the 4H chart.
The broader trend from May to June was clearly bullish, with prices forming higher highs and higher lows. However, after the rejection from the 72,000–73,500 area, short-term momentum weakened, and the index started to move sideways.
The first key resistance zone is 69,000–70,000. This is the nearest area where sellers may react again. If Japan 225 breaks above this zone, the next resistance area is around 71,000–72,000.
A stronger bullish continuation would require the price to reclaim 72,000–73,500. That area remains the major upper resistance zone.
On the downside, the nearest key support zone is 67,000–66,000. Holding above this area would keep the current recovery structure alive. Below that, 65,000–64,000 becomes the next important support zone.
If 64,000 breaks clearly, the index may return toward the deeper support area around 63,000–62,000.
Forward Outlook
For the bullish scenario, Japan 225 needs to hold above 67,000–66,000 and break above 69,000–70,000 with confirmation. If this happens, buyers may push the index toward 71,000–72,000.
If momentum remains strong above 72,000, the next upside target would be 72,000–73,500. A sustained move above this area would suggest that the broader bullish structure is starting to regain strength.
For the bearish scenario, if Japan 225 rejects from 69,000–70,000 and falls back below 66,000, short-term momentum may weaken. In that case, price could move lower toward 65,000–64,000.
A clean break below 64,000 would weaken the current recovery attempt and may bring price back toward 63,000–62,000.
Market Sentiment
Market sentiment is currently neutral with a cautious recovery bias.
Buyers are trying to defend the lower range and rebuild momentum, but the index still needs a confirmed breakout above 70,000 before the bullish view becomes more convincing.
Above 70,000, recovery momentum may improve.
Below 66,000, short-term bearish pressure may return.
Please share your view below:
Will Japan 225 break above 70,000 and continue toward 72,000? Or will sellers defend the resistance zone and push the index back toward 66,000?
If you find this analysis helpful, feel free to follow for more market structure and key level updates.