
Humira did $21.2 billion in 2022. That was 37% of AbbVie’s entire revenue, and a few years before that, it was more than half the company.
Then the patents went. Ten biosimilars came at it, and everybody on Wall Street spent years explaining why AbbVie couldn’t possibly replace that. The previous record for a drug going off patent was Pfizer’s Lipitor at around $13 billion a year, so this was the steepest cliff any drug company had ever walked off.
AbbVie’s answer was two immunology drugs, Skyrizi and Rinvoq, and management said flat out they’d eventually exceed what Humira did at its peak. Nobody believed it.
Look at the chart and tell me who was right.
The stock chopped from October into April and went nowhere, got flushed to about $190 in May, and it’s sitting at $256.17 right now.
The market has stopped pricing the cliff and started pricing what’s actually there, and the news flow keeps backing it up. On June 22, they agreed to buy Apogee Therapeutics for $10.1 billion, and the stock went up 6% on the announcement, which is not what usually happens to the buyer on a deal that size. Since then, they’ve released positive Phase 3 data for epcoritamab and received FDA approval for Skyrizi in pediatric patients. Analysts have been chasing it all month, with Citi and UBS both moving from $230 to $260, RBC to $280, and BMO from $258 to $300.
We looked at Merck yesterday, and healthcare is having a moment, no argument there.
But AbbVie is up 13.5% on the year against the S&P at 9.9% and the healthcare sector at 3.4%, so it’s beating the market and beating its own group at the same time.
Start with what’s underneath it, because that’s the part I keep going back to.
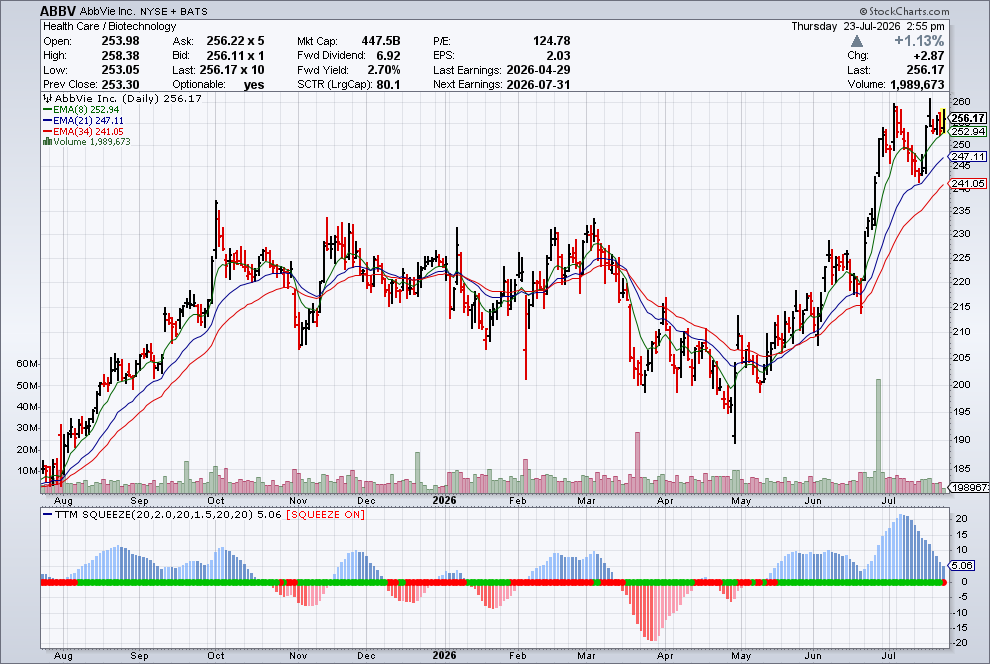
Six months of nothing. From October into April this stock chopped between roughly $205 and $235 and refused to go anywhere, and then May took it down to about $190. Anybody who bought it during that stretch and didn’t have real conviction is gone. They got bored out of it in the chop or scared out of it in the flush, and both of those are the same thing as far as the chart is concerned.
That’s a big, ugly, well-earned base. When a stock finally clears something like that, there’s very little supply left overhead to fight through, and you can see it in what July looked like.
The moving averages tell you the same story faster.
Daily 8 EMA at 252.94, 21 at 247.11, 34 at 241.05, price above all of them. Stacked in order, shortest to longest, which is what a trend looks like when the buyers are consistently paying up rather than waiting for a discount. The weekly is stacked the same way, and that agreement between timeframes is the part that matters. Plenty of stocks can stack a daily for two weeks. Getting the weekly to agree takes months of real buying.
Then there’s the squeeze.
Red dots on the zero line means volatility has been wrung out of this thing again. Bollinger Bands inside the Keltner Channels, price coiling instead of expanding, and the histogram underneath sitting positive.
One honest note on it. Momentum peaked a bit higher in early July and has come off that peak, so this isn’t a squeeze firing from a dead stop. It’s a stock that already moved, took a breath, and is compressing again. Different situation than a first fire, and you should know that going in rather than finding out later.
Your Action Plan
You’ve got a company that just walked off the biggest patent cliff in the history of the industry and came out the other side with something better than what it lost, a base built from six months of chop and a washout, EMAs stacked on both timeframes, and price coiling right at all-time highs.
The setup and the story are pointing in the same direction. That doesn’t happen as often as you’d think.
Earnings are July 31, seven days out.
If you want to know other setups I like, and more specifically, how I target short-term option trades for the potential triple-digit gains, then you’ll want to see this.