
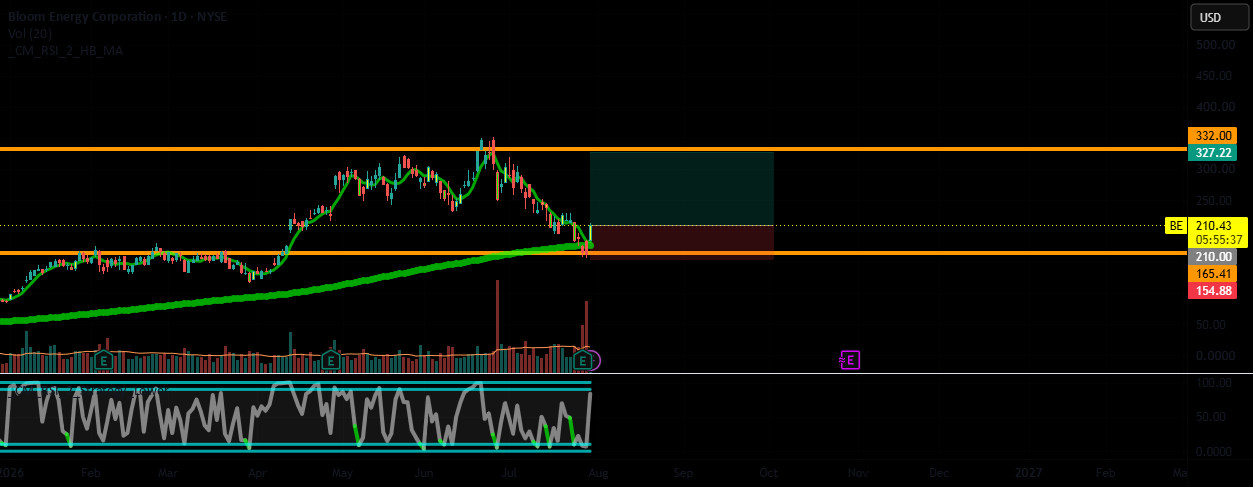
Strategy: Swing Trading / Position Trading
Ticker: BE (Bloom Energy)
Entry: $210.00
**Stop Loss:** $154.80
Take Profit: $327.20
Risk/Reward Ratio: ~1:2.1
📊 What Happened with Earnings?
Bloom Energy reported Q2 2026 results on July 28 after the close — and the numbers were absolutely staggering.
Revenue: $1.065 billion, up 166% year-over-year and 42% sequentially — the company’s first-ever $1 billion quarter
Product Revenue: $935 million, up 215% year-over-year
Non-GAAP EPS: $0.78, nearly double the $0.41 analyst estimate
GAAP EPS: $0.62, a $0.80 improvement from a ($0.18) loss a year ago
Operating Income: $240 million, up 737% year-over-year
Operating Margin: 22.5%, an expansion of approximately 1,536 basis points
Non-GAAP Gross Margin: 34.3%, up 604 basis points year-over-year
Cash Flow from Operations: $226 million, a $439.5 million improvement from last year
Free Cash Flow: $175 million
Full-Year 2026 Guidance Raised Significantly:
Revenue: $3.9 billion to $4.2 billion, implying ~100% growth at the midpoint
Non-GAAP Operating Income: $800 million to $900 million
Non-GAAP EPS: $2.55 to $2.85
Management Commentary:
CEO KR Sridhar stated: “The demand for Bloom Energy’s solutions keeps accelerating every quarter as customers who traditionally defaulted to combustion technologies are now proactively choosing Bloom. Today, all the major US hyperscalers and over a dozen US neoclouds, AI labs, and colocation data center operators have validated and approved our power solutions for their AI factories. Bloom is now a standard for AI onsite power.”
CFO Simon Edwards added: “This quarter was the strongest in Bloom’s history, with profitable growth and positive operating cash flow.”
The Big Picture:
Bloom is now growing faster than Nvidia — 166% revenue growth vs. Nvidia’s 85% in its latest quarter. The company expanded its strategic partnership with Brookfield from $5 billion to **$25 billion**, showcasing massive financial backing. With more than $27 billion of financing capacity, validation from all major U.S. hyperscalers, and a backlog growing faster than revenue, Bloom has established itself as the standard for onsite AI data center power.
🔍 The Technical Setup
The post-earnings reaction has been volatile — a classic “buy the rumor, sell the news” pattern following a massive year-to-date run.
Pre-earnings close (July 28): $166.84
Post-earnings open (July 29): Gapped up to $183.50
July 29 high: $185.66
July 29 close: $163.75, down -1.85% on the day
Volume: 41.8 million shares, well above average
52-Week Range: $32.52 to $351.28
200-Day SMA: ~$176.86
The stock has pulled back more than 30% from its June highs, yet the long-term trend remains intact with the stock still well above its 200-day moving average over the medium term. RSI(14) sits near 48 — neutral territory with room to run. MACD has been negative in the short term, reflecting the recent pullback, but the blowout earnings are likely to reverse that momentum.
**Entry at $210.00:** This represents a breakout above the post-earnings volatility range. The stock traded as high as $185.66 immediately after earnings, and a move to $210 would confirm that buyers are absorbing supply and pushing toward the next resistance zone. This entry allows us to capture the continuation of the post-earnings momentum once the initial volatility settles.
**Stop Loss at $154.80:** Positioned below the July 29 low of $157.33 and the 200-day SMA around $176.86. A break below $154.80 would suggest the post-earnings setup has failed and the stock is breaking key support levels.
**Take Profit at $327.20:** This sits between the highest Street target of $390 and the average target of $280. Taking profits here allows us to bank gains near the upper end of the analyst range while leaving room for potential upside beyond.
📈 Analyst Consensus — Upgrades and Target Hikes Coming In
The analyst community is responding to the blowout quarter with upgrades and target increases:
Consensus Rating (28 analysts): Buy
Average Price Target: $280.29
Highest Target: $390 (implying 138% upside)
Lowest Target: $97
Recent Analyst Moves:
J.P. Morgan: Overweight, target $314 (from $346)
Mizuho: Upgraded to Outperform from Neutral, target $242 — citing stronger execution, accelerating margin expansion, improving operating leverage, and arguing the recent pullback has created an attractive entry point
RBC Capital: Buy, maintained target at $335
Morgan Stanley: Buy, maintained target at $310
Clear Street: Upgraded to Buy, target $290
BMO Capital: Hold, lowered target from $279 to $227
Truist Financial: Hold, lowered target from $250 to $218
Jefferies: Hold, lowered target from $246 to $188
Key Analyst Takeaways:
Mizuho highlighted Bloom’s time-to-power advantage, more than $27 billion of financing capacity, validation from all major U.S. hyperscale customers, and a backlog growing faster than revenue
The brokerage noted recent progress on permitting in New Mexico as an incremental positive
While some analysts trimmed targets due to valuation multiple compression across the peer group, the fundamental outlook remains strong
⚠️ Key Risks to Monitor
Valuation: The stock has already had a massive year-to-date run. Any disappointment in future quarters could trigger sharp pullbacks
Execution risk: The company must continue to deliver on its raised guidance of 100% revenue growth for 2026
Competition: Other onsite power solutions providers could emerge as AI data center demand continues to surge
Regulatory and permitting risks: While progress in New Mexico is positive, permitting remains a potential bottleneck
Post-earnings volatility: The stock has already experienced a “gap up then sell-off” pattern; more volatility is likely as the market digests the results
Short-term technical weakness: RSI near neutral and MACD negative indicate that short-term momentum is still recovering
📋 Trade Management Plan
Entry: Start with 50% of your intended position at $210.00
Add: Scale in with the remaining 50% if price confirms at $230.00
Breakeven: Move stop loss to breakeven ($210.00) once price hits $260.00
Trailing stop: Raise SL to $230.00 if price reaches $290.00
Partial take-profit: Close 50–70% of the position at $327.20
Let it run: Keep the rest with a trailing stop if price pushes toward $350+
💡 Final Take
Bloom Energy delivered a historic blowout quarter: first-ever $1 billion quarter, 166% revenue growth, EPS of $0.78 nearly doubling estimates, and a raised full-year guidance of ~100% revenue growth. The company has become the standard for AI onsite power, with validation from all major U.S. hyperscalers and more than $27 billion in financing capacity.
The stock is growing faster than Nvidia, and the AI data center power demand story is only accelerating. The recent 30%+ pullback from June highs, combined with the blowout earnings and raised guidance, has created a compelling risk/reward setup.
The analyst community is responding with upgrades — Mizuho upgraded to Outperform, Clear Street to Buy — and the average price target of $280 implies 71% upside from current levels. J.P. Morgan maintains Overweight at $314, and RBC and Morgan Stanley both maintain Buy with targets of $335 and $310 respectively.
The setup offers a compelling 1:2.1 risk/reward ratio with three layers of confirmation:
Fundamental: Historic beat-and-raise, record margins, 100% revenue growth guidance, $27B financing capacity
Technical: Post-earnings consolidation after a 30%+ pullback, setting up for the next leg higher
Sentiment: Upgrades rolling in, Buy consensus, average target of $280 implying 71% upside
The post-earnings dip is the opportunity. The upside is the AI power megatrend.
⚠️ Disclaimer: This post is for educational and analytical purposes only. It does not constitute financial advice. Always conduct your own research and assess your personal risk tolerance before making any investment decisions. Trading involves the risk of capital loss.
What’s your take on BE? Buying the dip or waiting for more clarity? Drop your thoughts below 👇
#BE #BloomEnergy #TradingView #Earnings #SwingTrading #AI #ArtificialIntelligence #Energy #FuelCell #TechnicalAnalysis #Stocks #Investing #StrongBuy