
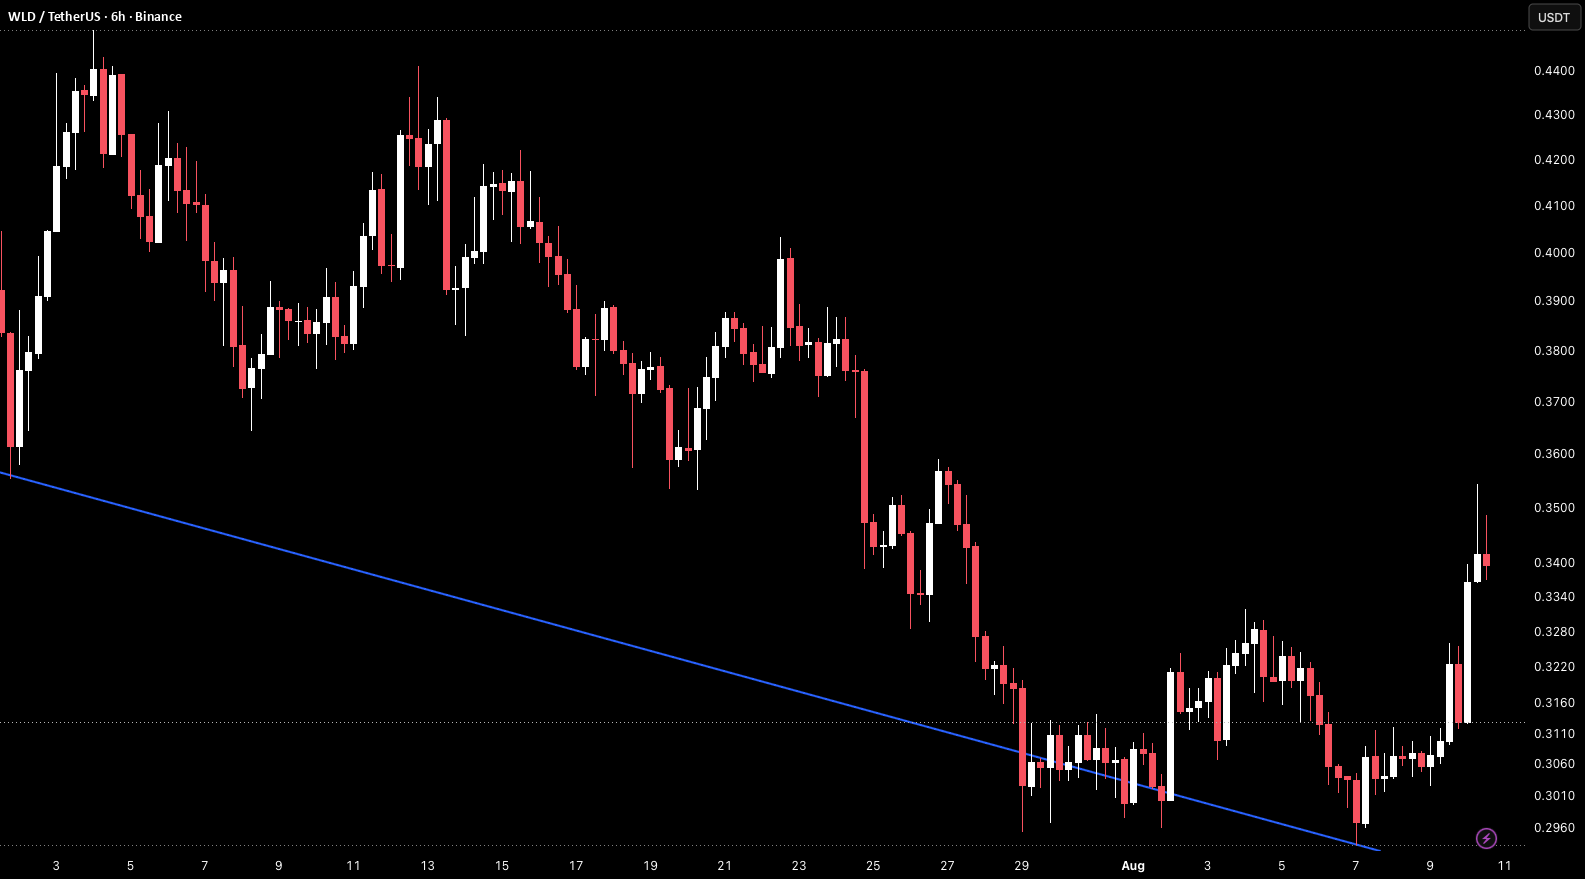
WLD on the 6H timeframe is currently trading around 0.3836 after breaking below the descending trendline support near 0.3060–0.3100 in late July and dropping to a low near 0.2960 before recovering sharply, with price now pressing into the 0.3396–0.3500 horizontal resistance zone that has been a consistent pivot throughout the post-breakdown structure.
The chart shows a descending trendline originating from the early July low near 0.3560, connecting the July 8 low near 0.3500 and continuing to slope downward across the entire visible structure into the 0.2960–0.3000 area before the breakdown. Price ground lower along the trendline from early July through late July, with recoveries consistently capped and each successive high lower than the prior one. The trendline was eventually broken to the downside in late July as price accelerated through 0.3160–0.3200 and into the low near 0.2960 before reversing sharply. A horizontal level near 0.3160–0.3200 has been a recurring reference through the lower portion of the structure and is now sitting as support after being reclaimed on the recovery. The sharp bounce from 0.2960 pushed price back through 0.3160–0.3200, 0.3280–0.3320, and now into the 0.3396–0.3500 zone where the broken descending trendline previously sat.
Price has recovered nearly the entire breakdown move in a single sharp candle and is now pressing into the first meaningful resistance above the low, with the broken trendline level sitting as the key reference for whether the move was structural or a liquidity event.
Key Levels To Watch
→ 0.4200–0.4400 Prior range high, major resistance above
→ 0.3800–0.3900 Mid-range resistance zone
→ 0.3500–0.3560 Prior breakdown zone, resistance
→ 0.3396–0.3500 Horizontal resistance, current test
→ 0.3160–0.3200 Reclaimed support, key level on pullback
→ 0.3060–0.3100 Prior trendline level, secondary support
→ 0.2960–0.3000 Breakdown low, macro support floor
A confirmed 6H close above 0.3396–0.3500 and follow-through above 0.3500–0.3560 would suggest the breakdown was a liquidity sweep rather than a structural break, reopening a move toward 0.3800–0.3900 and potentially 0.4200–0.4400 on continuation.
A rejection at 0.3396–0.3500 and a return below 0.3160–0.3200 would keep the bearish structure intact, and a loss of 0.3060–0.3100 on a confirmed close would reopen the risk of a retest of the breakdown low near 0.2960–0.3000.
Sharp recovery from breakdown low now testing first meaningful resistance. Break above 0.3500–0.3560 → breakdown invalidated, eyes on 0.3800–0.4200. Reject here and lose 0.3160–0.3200 → bearish structure intact, retest of 0.2960 open. Bias neutral pending confirmation. Shift bullish only on confirmed close above 0.3500–0.3560.