
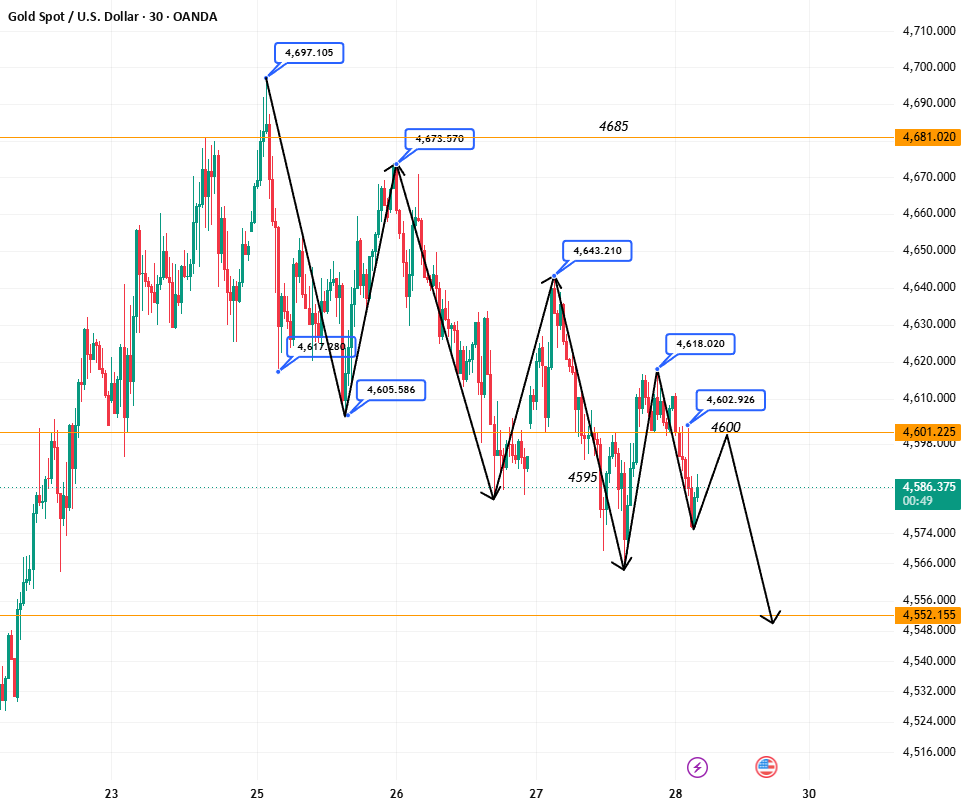
Yesterday, gold rose to $4,643 during the Asian session before shifting back to a downward trend. It traded lower during the European session and fell to a low of $4,566 in the New York market before rebounding to close at $4,589, forming a “Doji” star on the daily chart. The KDJ indicator formed a bearish cross at a high level following an overbought state, and auxiliary indicators have turned downward; the MACD bullish momentum bars are shrinking, indicating that the bearish trend remains dominant on the daily chart.
On the hourly chart, gold began to decline after rising to $4,611 during the Asian session and is currently trading near $4,585. The MA5 and MA10 moving averages are sloping downward, the KDJ indicator has formed a bearish cross at a low level, auxiliary indicators have turned downward, and MACD bearish momentum bars are expanding, suggesting a bearish short-term outlook. Combining this with the daily trend, the recommended strategy for the day is to prioritize selling at resistance levels; watch for resistance at the hourly chart’s Bollinger Bands middle rail ($4,600) and support near $4,550.
Recommendations:
SELL: 4601–4606 | SL: 4616 | TP: 4580–4570
BUY: 4550–4555 | SL: 4540 | TP: 4580–4590