
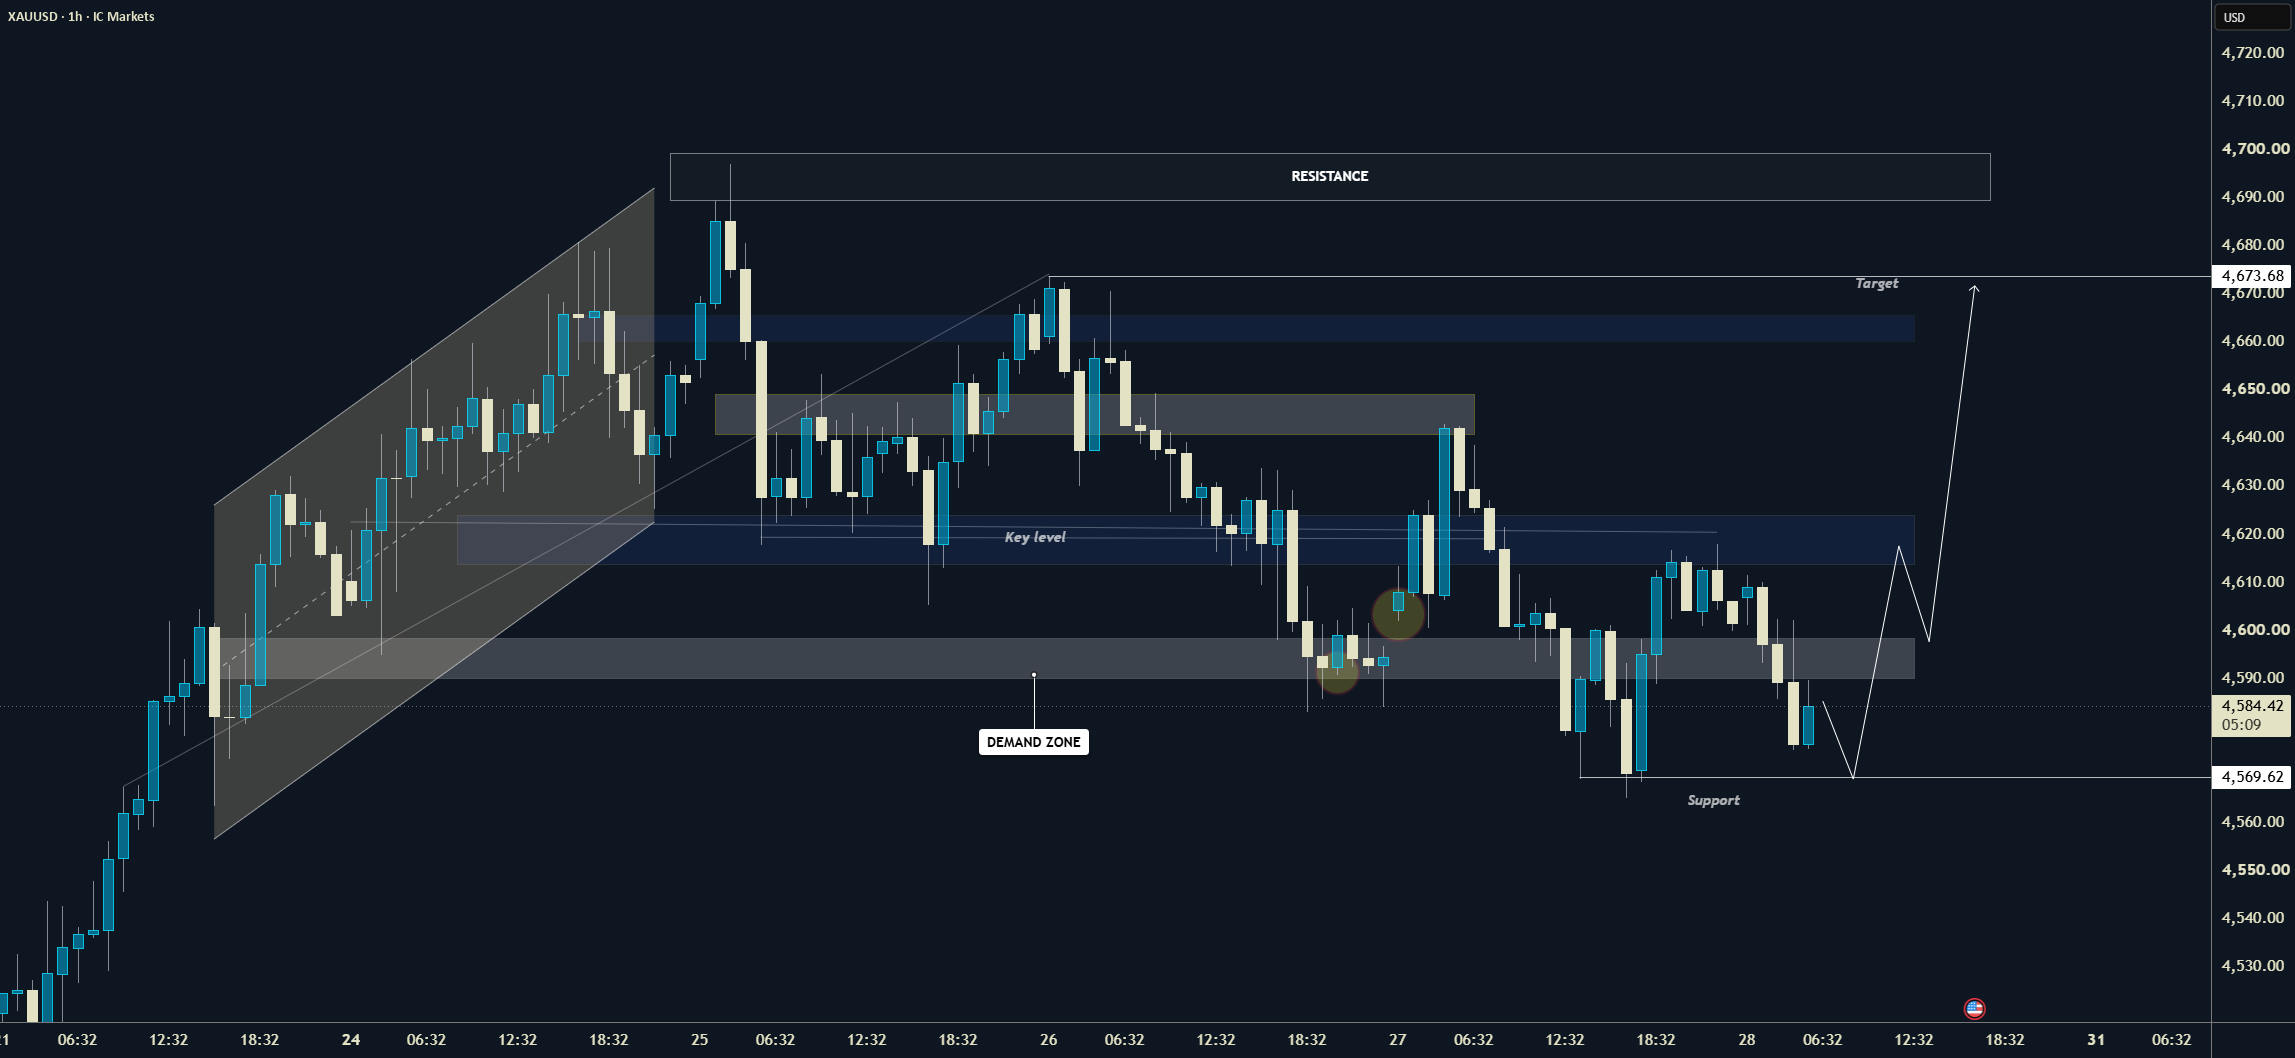
There is something I dislike about the obvious trade on Gold right now.
Everyone can see 4,570.
Everyone can see price approaching it.
And that is exactly why I do not want to simply place a BUY there.
The H1 chart has been leaking lower since the rejection from 4,670. More importantly, every recovery has achieved less than the one before it. Buyers once fought near 4,645. Then the battle moved to 4,620. Now they are being pushed back toward 4,570.
That tells me one thing:
Gold is running out of floor.
But running out of floor and falling through it are not the same event.
So today I am trading the mistake, not the level.
TRADE #1: LET SELLERS MAKE THE MISTAKE
Imagine Gold prints 4,568.
Maybe even 4,562.
The chart suddenly looks bearish, stops underneath the current low get triggered, and breakout sellers enter expecting another leg down.
Then Gold comes straight back.
That is the trade I want.
Not because 4,570 is “strong support,” but because a failed breakdown would leave fresh sellers trapped underneath a level they thought had already broken.
My trigger is an H1 sweep below 4,570, followed by a recovery and close back above 4,580.
Then:
BUY 4,578–4,585
SL 4,555
TP1 4,600
TP2 4,620
TP3 4,645
I would take something off at 4,600.
Why so early?
Because this is initially a trap trade, not a declaration that Gold has turned bullish.
The real test comes later.
THE TRADE CHANGES ITS NAME AT 4,620
If the first long works, Gold eventually runs into an old problem.
4,615–4,625.
This area previously behaved as support.
Now price is underneath it.
That means I treat a rally into 4,620 as a test of the previous floor from the wrong side.
Here is where two completely different trades can be born from almost the same price.
Gold reaches 4,620 and gets punched back below 4,610?
I am interested in selling.
SELL 4,610–4,618
SL 4,633
TP1 4,590
TP2 4,570
TP3 4,545
But suppose the opposite happens.
Gold closes above 4,625.
It comes back.
4,620 refuses to break.
Now I have no reason to fight the recovery.
BUY 4,620–4,627
SL 4,598
TP1 4,645
TP2 4,663
TP3 4,673
Same neighborhood.
Opposite trades.
The candle behavior decides which one exists.
NOW FOR THE UGLY VERSION
Suppose there is no trap at 4,570.
No sharp recovery.
No heroic buyer stepping in.
Gold simply closes underneath it.
That would matter because 4,570 is currently the final visible H1 floor beneath the recent consolidation.
But even here, I do not want the first red candle.
Breakout candles often give terrible entries.
I would rather watch Gold crawl back toward 4,565–4,575 afterward.
If buyers cannot climb back above the broken floor, that tells me the market did not merely visit prices below 4,570.
It accepted them.
That is a much more bearish message.
SELL 4,563–4,571
SL 4,590
TP1 4,545
TP2 4,525
TP3 4,500
A clean H1 reclaim above 4,590 kills this idea.
I do not want to remain short after the market proves the breakdown was fake.
MY SCOREBOARD IS 0–0
This is how I am treating today’s chart.
Buyers score 1 point:
Sweep 4,570 and recover 4,580.
Buyers score the second point:
Take 4,625 and successfully defend it.
That opens 4,645 → 4,663 → 4,673.
Sellers score 1 point:
Close below 4,570.
Sellers score the second point:
Retest 4,570 and fail to reclaim it.
That opens 4,545 → 4,525 → 4,500.
Until somebody scores?
0–0. No trade.
This is important because Gold sitting at 4,585 may look like an attractive discount after the decline.
I don’t see a discount.
I see a market standing 15 dollars above the level where somebody is about to be proven wrong.
And I would rather trade the trader who gets trapped than guess which side will trap them.
So who gets caught first today: breakout sellers below 4,570 or dip buyers trying to defend it?