
📊 Technical Analysis
Pair: HAEDAL/USDT
Time Frame: 3D
Pattern: 📉 Descending Trendline / Long-Term Downtrend
Current Price: ± $0.01851
Major Low: ± $0.01411
—
🔎 Chart Structure
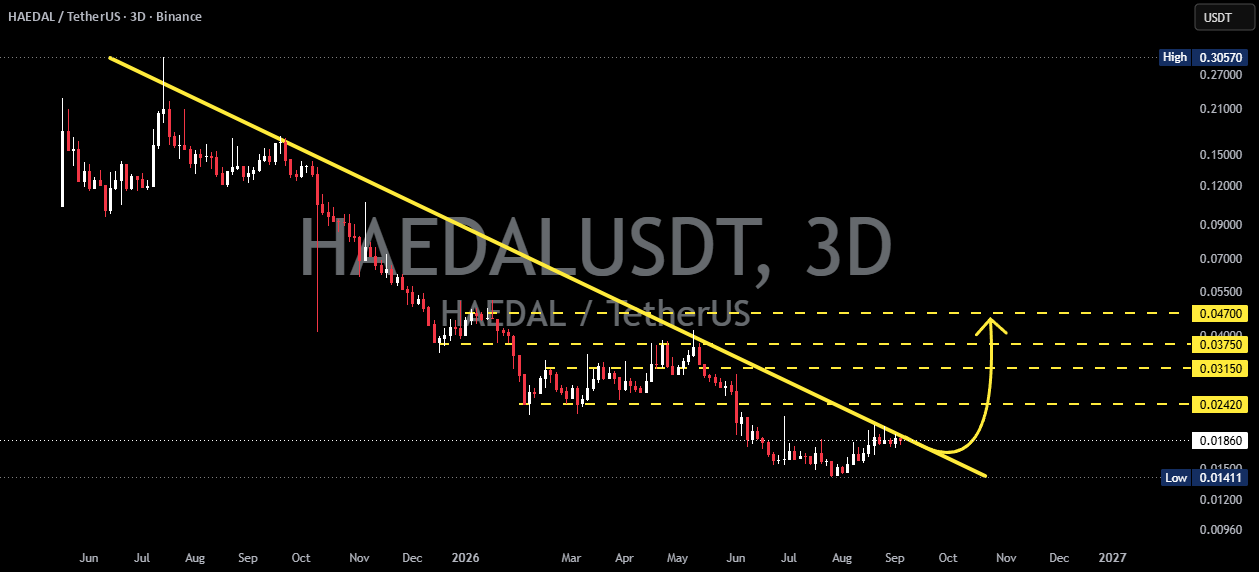
HAEDAL/USDT remains below the descending trendline that has been forming since the high around $0.30. The yellow trendline represents long-term bearish pressure, with the price consistently forming Lower Highs.
However, there is an interesting change in the price structure:
🟡 Price is beginning to form a base/accumulation area around $0.0141–$0.0185.
📈 After a prolonged decline, the price appears to be recovering from the low area and is once again approaching the descending trendline.
⚠️ The descending trendline remains the key resistance. As long as price has not broken and confirmed above it, the long-term trend should still be considered bearish.
—
🟢 BULLISH SCENARIO — Breakout Confirmation 🚀
The bullish scenario becomes increasingly interesting if HAEDAL manages to:
1. 🟢 Break above the descending trendline
2. 🔄 Achieve a 3D candle close above the trendline
3. 🧲 Retest the trendline and turn it into support
4. 📈 Continue higher through the horizontal resistance levels.
🎯 Bullish Targets
TP1: $0.02420
TP2: $0.03150
TP3: $0.03750
TP4: $0.04700
If all of these resistance levels are successfully broken, the market structure could undergo a significant transition from long-term bearish → bullish reversal.
🔥 The $0.04700 area represents an important resistance/supply zone highlighted on the chart.
—
🔴 BEARISH SCENARIO — Rejection From Trendline 📉
The bearish scenario remains valid if:
❌ Price fails to break above the descending trendline
❌ A strong rejection occurs around the trendline
❌ Price forms another Lower High
❌ The $0.0185 and subsequently $0.0141 support levels are broken.
If $0.0141 loses support, the bullish setup would weaken significantly, increasing the risk of a new low.
📉 As long as the descending trendline has not been decisively broken, any upward movement can still be considered a relief rally within the larger bearish structure.
—
🧩 Pattern Explanation — Descending Trendline
📉 A Descending Trendline forms when price consistently creates Lower Highs, allowing a resistance line to be drawn from the upper-left toward the lower-right.
On this chart, the descending trendline has remained intact for an extended period.
💡 The longer a trendline remains valid and the more times price retests it, a confirmed breakout can become an important technical event.
However, a breakout becomes more reliable when accompanied by:
✅ 3D candle close above the trendline
✅ Strong bullish momentum
✅ Successful retest
✅ Previous resistance turning into support
✅ Formation of a Higher High / Higher Low structure
—
⚖️ Key Levels to Watch
🟢 $0.02420 — First major resistance
🟡 $0.03150 — Important breakout zone
🟡 $0.03750 — Major resistance
🔥 $0.04700 — Major bullish target / supply zone
🔴 $0.01851 — Current key area
🛡️ $0.01411 — Major swing low / critical support
—
🧠 Market Outlook
📌 Short-term: Price is attempting to recover from the low area.
📌 Medium-term: Bullish momentum could develop if the descending trendline is successfully broken.
📌 Long-term: A breakout followed by a successful retest could provide an early indication of a trend reversal from the prolonged downtrend.
🚨 Invalidation: A strong break below $0.01411 would significantly weaken the bullish reversal thesis.
🔥 Conclusion
HAEDAL is currently in an interesting technical position as price approaches the long-term descending trendline.
🟢 Breakout + 3D confirmation + successful retest = bullish reversal setup.
🔴 Rejection + breakdown below $0.01411 = bearish continuation risk.
> ⚠️ This is a technical analysis scenario, not a guaranteed price prediction. Always conduct your own research before making trading decisions.
#HAEDAL #HAEDALUSDT #Crypto #CryptoAnalysis #TechnicalAnalysis #Altcoins #CryptoTrading #PriceAction #DescendingTrendline #Breakout #BullishReversal