Skip to content
Vorkast
  • Home
  • Blog
  • ChartExpand
    • Trading Chart
    • Quick Reference Chart
  • AnalysisExpand
    • Crypto
    • Forex Analysis
    • Precious Metal Analysis
    • Stock Analysis
0
Vorkast
Home / Analysis / Forex Analysis / How will gold react after the news?

How will gold react after the news?

How will gold react after the news?

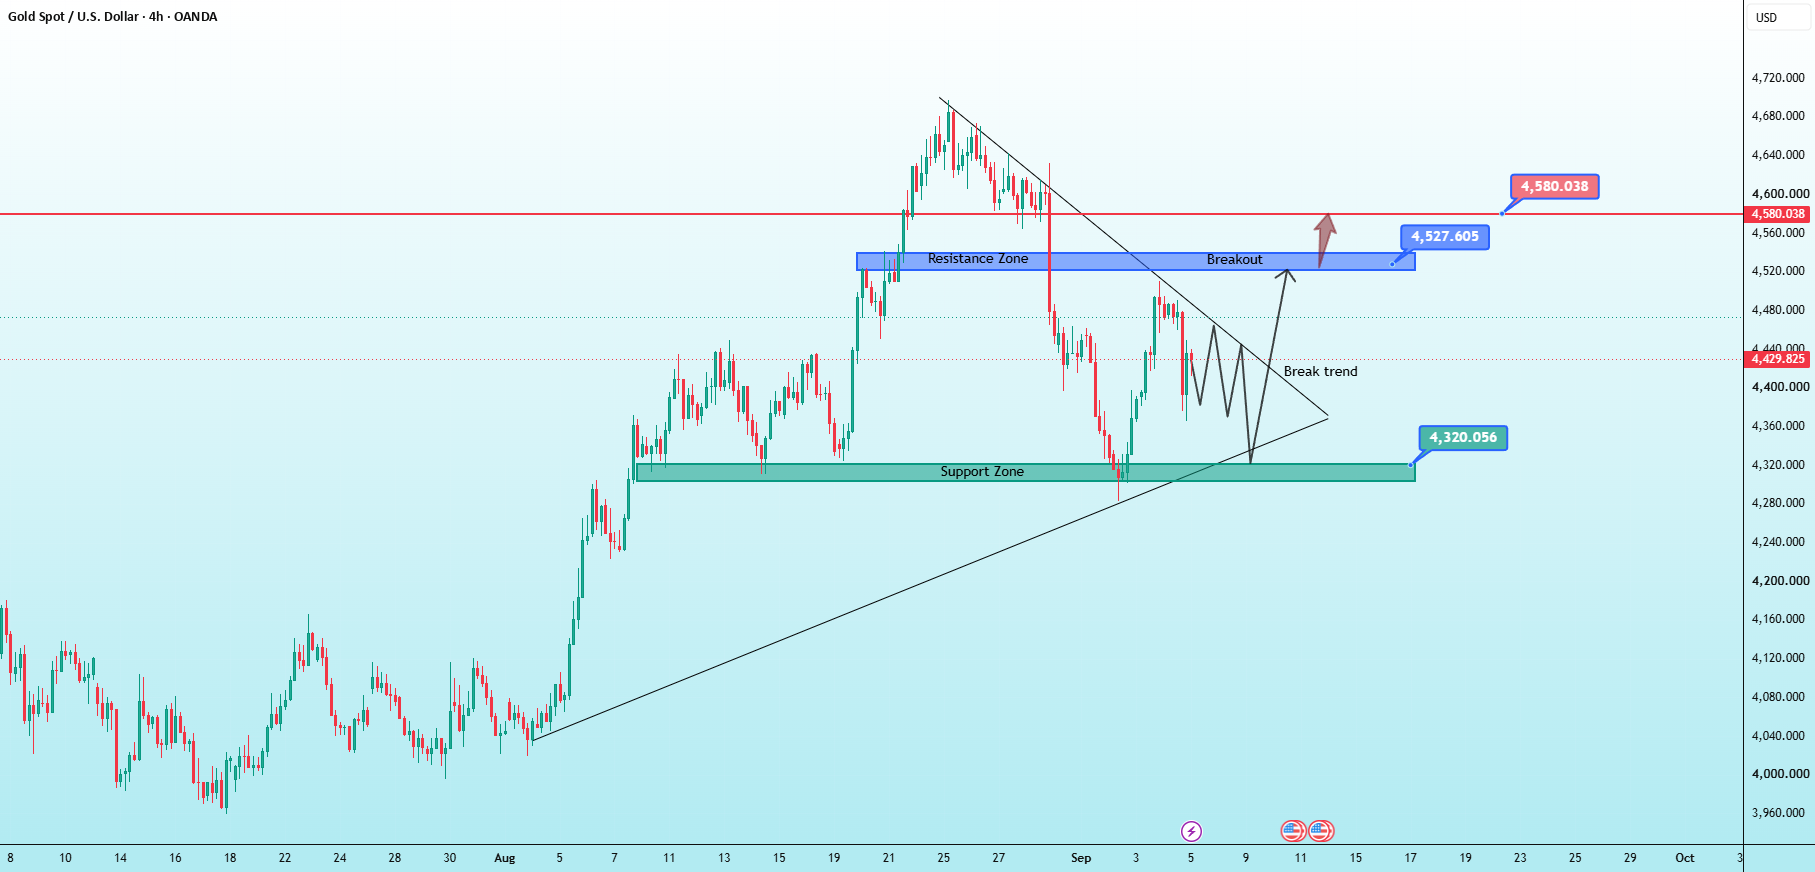
Based on the XAU/USD chart, the current structure shows that price is correcting within a larger uptrend. The most notable point is that price is currently trading between support at 4,320 and resistance at 4,527–4,580, while a descending trendline needs to be broken to confirm a return of bullish momentum.

🔴 Resistance

1. 4,520 – 4,535 — Key Resistance

This is the Resistance Zone on the chart.
Reference level: 4,527.605.
This is also the breakout area that price needs to overcome to confirm a breakout from the current corrective structure.
If price tests this zone but gets rejected → the possibility of continued sideways movement/correction remains.

2. 4,570 – 4,585 — Strong Resistance

Key level around 4,580.038.
This is the next target after a breakout above 4,527.
If price breaks above this entire zone, the bullish structure will become very positive.
🟢 Support

1. 4,315 – 4,330 — Main Support

This is an important Support Zone, with the key level at 4,320.056.
Price has reacted several times around this area.
More importantly, the long-term ascending trendline is also converging around this support zone.
If the 4,315–4,330 zone continues to hold → this remains the preferred area to look for BUY signals.
📉 Descending Trendline

The trendline from the most recent high is currently putting pressure on price.

The structure can currently be viewed as:

Bottom → strong rally → formation of a high → correction → consolidation below the descending trendline.

Therefore, a trendline breakout + break above 4,527 will be more significant than simply a spike above the resistance zone.

📈 Bullish Scenario

The ideal scenario:

4,320 → consolidation → break the descending trendline → break 4,527 → 4,580

After breaking above 4,527, it would be better to wait for price to retest 4,520–4,535 and hold this zone. This would provide a more reliable confirmation of continued bullish momentum.

Targets:

TP1: 4,527
TP2: 4,580
Break above 4,580 → further upside targets can be extended.
📉 Bearish Scenario

If price continues to be rejected below the trendline and fails to break 4,520–4,535, it could move back toward:

4,450 → 4,400 → 4,320

In particular, if 4,320 is strongly broken, the current bullish scenario will weaken significantly, and the larger market structure will need to be reassessed.

Recent Posts

  • RIG Transocean: Strong Contracts, Debt Reduction & Merger Upside
    RIG Transocean: Strong Contracts, Debt Reduction & Merger Upside
  • WULF TeraWulf AI/HPC Data Center and Massive Power Capacity!
    WULF TeraWulf AI/HPC Data Center and Massive Power Capacity!
  • AUS200: how far does the next ASX session dip?
    AUS200: how far does the next ASX session dip?
  • Key resistance ahead?
    Key resistance ahead?
  • MSFT
    MSFT

Recent Comments

No comments to show.

Category

  • Analysis
  • Commodity & Future News
  • Commodity Analysis
  • Crypto Analysis
  • Cryptocurrency News
  • Forex Analysis
  • Forex News
  • News
  • Stocks Analysis
  • Stocks News

Tags

Disclaimer

Financial market trading has large potential rewards, but also large potential risks. You must be aware of the risks and be willing to accept them to invest in the financial markets. Nothing on our website shall be deemed a solicitation to buy or sell; it is up to the trader to take that information and determine his or her trading strategy.

Account

  • Edit Account
  • My Account
  • My Cart
  • My Orders
  • Wishlist

Policies

  • Privacy Policy
  • Return Policy
  • Terms of Use
  • Cookies
  • Disclaimer

© 2026 Vorkast. All Rights are Reserverd

We care about your privacy

In order to provide you a personalized shopping experience, our site uses cookies. By continuing to use this site, you are agreeing to our cookie policy.

Ask a question

Share


Lost your password?


Don't have an account yet? Sign up

Shopping Cart

Your cart is empty

No items in your cart. Go on, fill it up with something you love!

Start Shopping Now
Select the fields to be shown. Others will be hidden. Drag and drop to rearrange the order.
  • Image
  • SKU
  • Rating
  • Price
  • Stock
  • Availability
  • Add to cart
  • Description
  • Content
  • Weight
  • Dimensions
  • Additional information
Click outside to hide the comparison bar
Compare
Scroll to top
  • Home
  • Blog
  • Chart
    • Trading Chart
    • Quick Reference Chart
  • Analysis
    • Crypto
    • Forex Analysis
    • Precious Metal Analysis
    • Stock Analysis
Search