
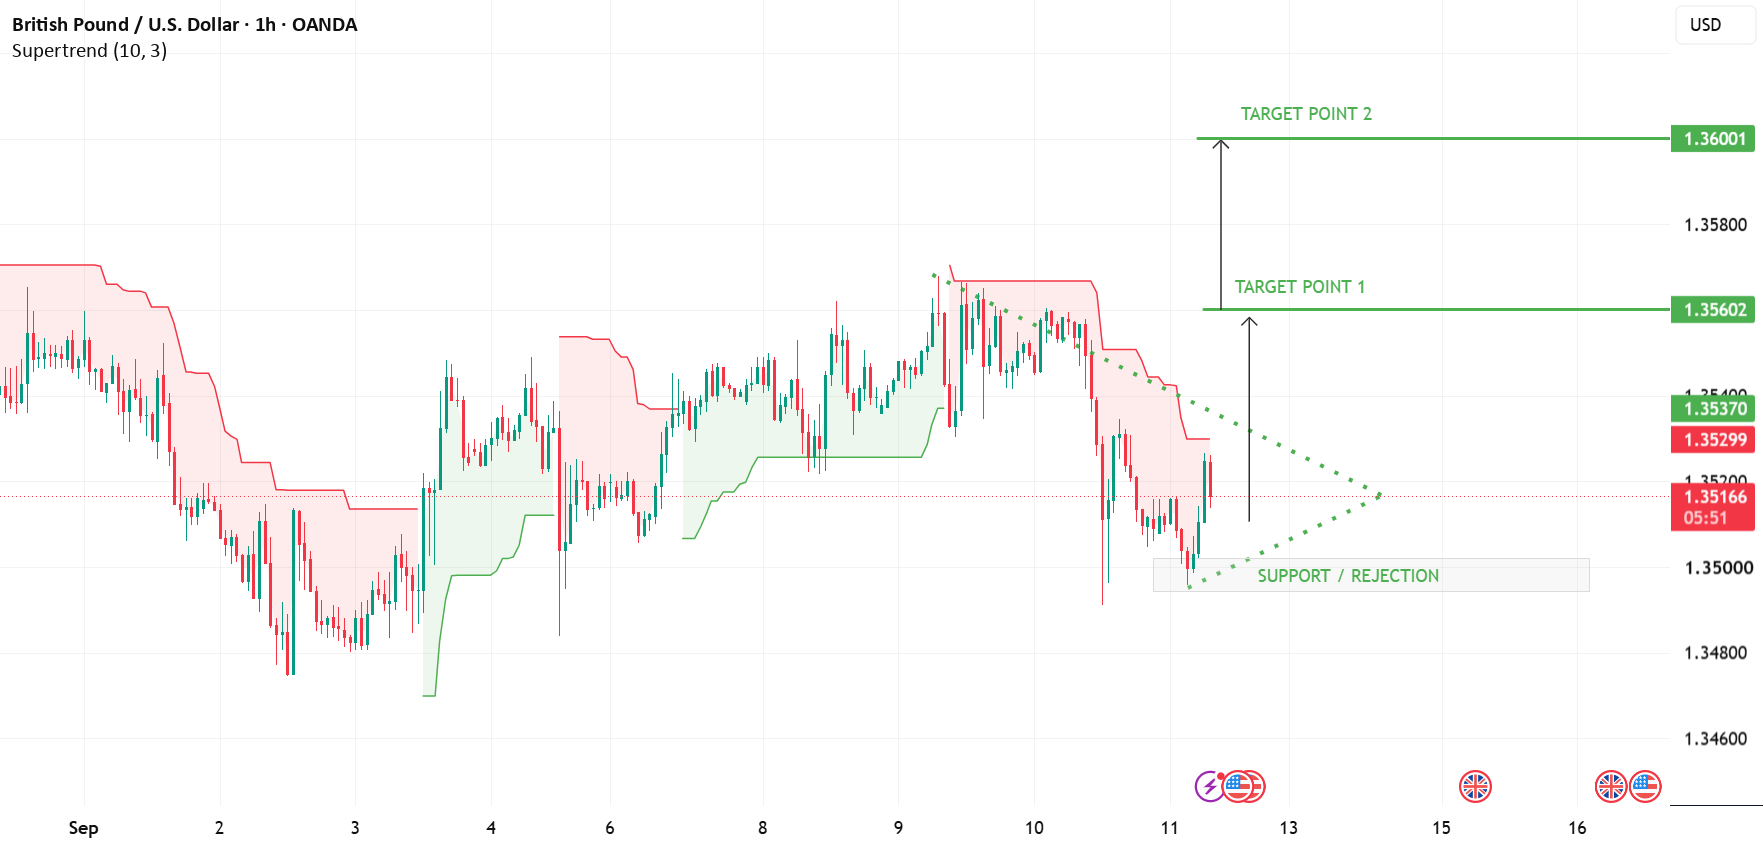
GBPUSD | Descending Trendline Breakout & Bullish Confluence
Fundamental View
GBPUSD is showing signs of strength after recovering from the 1.3500 support area. The broader currency market remains highly sensitive to central-bank expectations and inflation dynamics. The ECB raised rates by 25 basis points, reflecting persistent inflation pressures, while expectations surrounding further global rate adjustments continue to influence USD flows.
However, the ECB decision should be viewed as a broader FX-market catalyst rather than a direct GBPUSD driver. For GBPUSD, the relative outlook between the Bank of England and Federal Reserve remains more important.
Technical View
On the 1H chart, GBPUSD has reacted positively from the 1.3500 support/rejection zone.
Price is currently attempting to reclaim the Supertrend area around 1.3530, while the descending structure remains an important obstacle. A sustained break above 1.35395 could provide confirmation that buyers are gaining short-term control.
If price clears 1.35600 with strong momentum, the bullish continuation scenario could open the way toward 1.36001.
SMC View
From an SMC perspective, the 1.3500 region is acting as a demand/support area where sellers previously failed to maintain downside pressure.
The recent reaction suggests that sell-side liquidity around the lows may have been absorbed. The key confirmation would be a break of the nearby resistance structure around 1.35395–1.35600.
A successful breakout could shift short-term market structure bullish and attract additional liquidity toward the 1.3600 area.
This Move Is Supported By
• Strong reaction from the 1.3500 support zone
• Recovery back toward the descending structure
• Potential short-term shift in momentum
• Buyers defending the recent lows
• A possible breakout above 1.35395–1.35600 resistance
Trading Scenario
Bullish Scenario:
If GBPUSD maintains the 1.3500 support and breaks above 1.35395, the next resistance comes around 1.35600.
A confirmed break and hold above 1.35600 could expose the 1.36001 target zone.
Bearish Invalidation Scenario:
If price fails to hold 1.3500 and produces a sustained bearish breakdown below this support, the bullish setup would weaken and the market could return toward lower liquidity zones.
Key Levels
Resistance: 1.35395
Major Resistance: 1.35600
Bullish Target 1: 1.35602
Bullish Target 2: 1.36001
Key Support: 1.35000
Bullish Invalidation: Sustained break below 1.35000
Professional Insights
The key area to watch is 1.35395–1.35600. This zone should determine whether the current recovery develops into a broader bullish continuation or simply becomes another rejection within the existing range.
For confirmation, I would look for a clean breakout, preferably followed by a retest that holds above resistance. That would provide stronger evidence of a structural shift rather than relying on a single intraday spike.
Risk Management
Avoid treating the 1.3500 support as an automatic entry level. Wait for price action confirmation and manage position size according to your individual risk tolerance.
A sustained move below 1.3500 would weaken the bullish thesis and should be considered when reassessing the setup.
Disclaimer
This analysis is for educational purposes only and does not constitute financial advice. Market conditions can change quickly, and all trading decisions should be based on your own research and risk management.