
This is kurutologic.
Today, I am sharing a structural analysis of Gold (XAU/USD) on the 4H timeframe, focusing on a critical chart pattern setup.
■ Market Overview
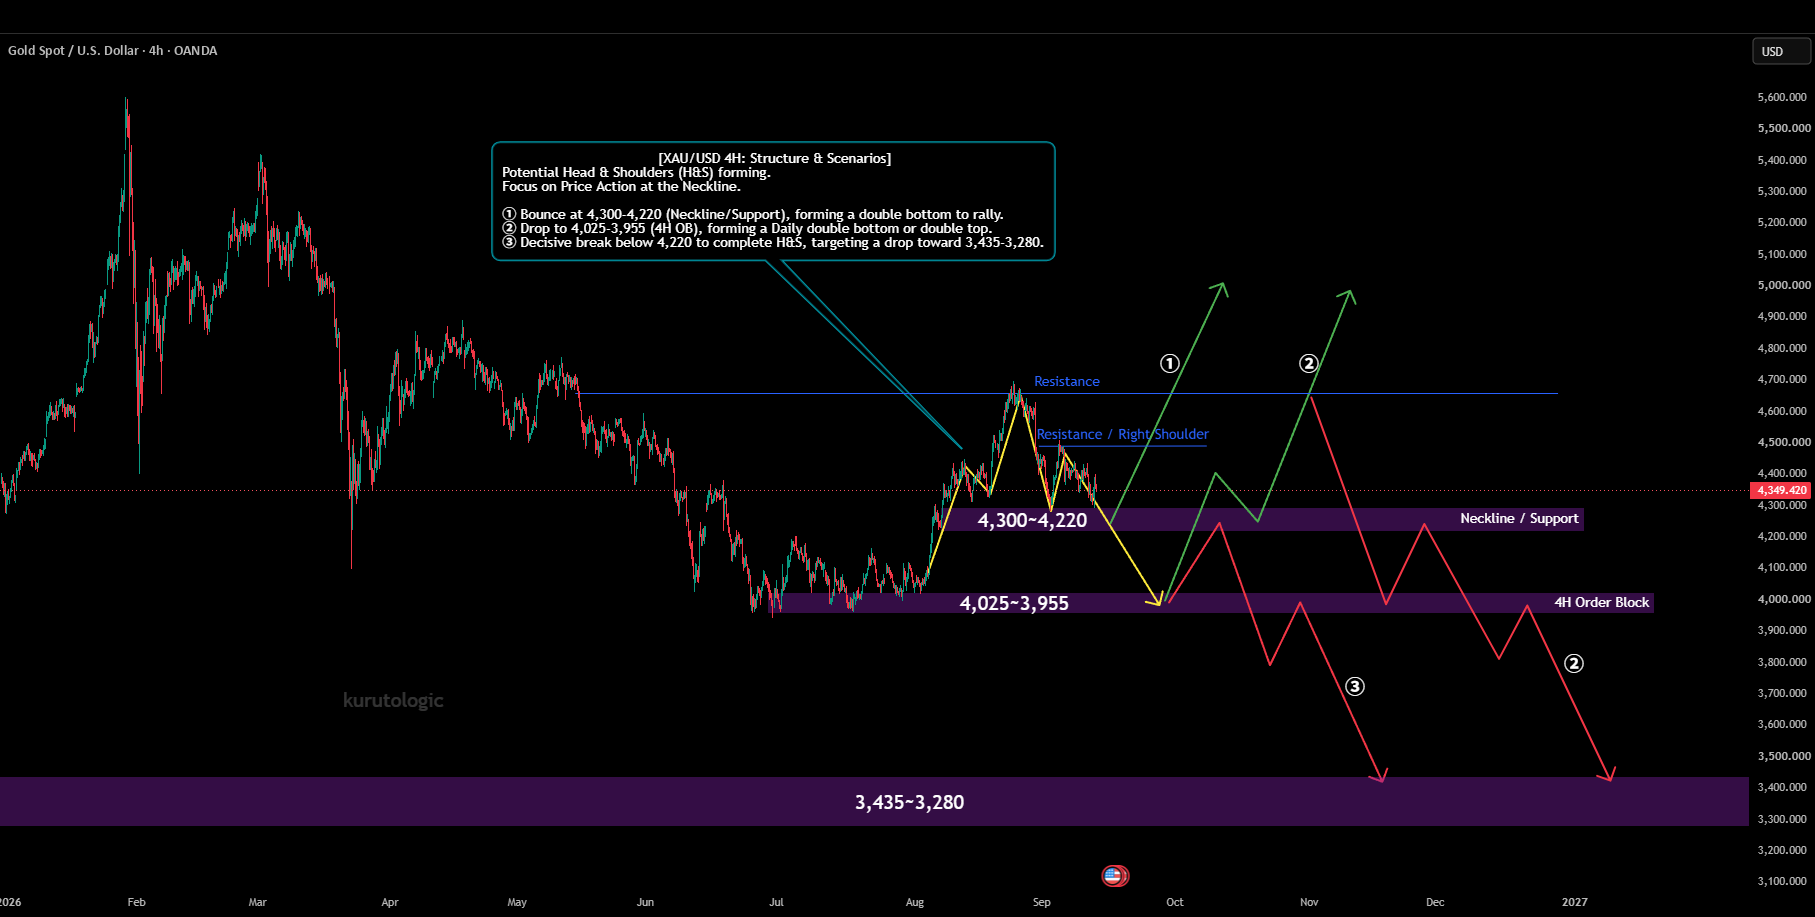
We are currently observing the potential formation of the right shoulder of a Head and Shoulders (H&S) pattern on the 4H chart.
Price is actively testing the Neckline / Support zone (4,300-4,220). The price action at this specific level will dictate the next major market move.
■ 3 Key Scenarios
I have outlined three potential pathways (①-③) on the chart:
① Bounce at Neckline (Double Bottom)
Price finds support at the 4,300-4,220 Neckline, forming a double bottom. This scenario invalidates the H&S pattern and provides a high-probability setup to target the upper resistance level.
② Drop to 4H OB (Structural Correction)
If the neckline breaks, the next logical draw on liquidity is the 4H Order Block at 4,025-3,955. At this level, we will monitor whether the market forms a Daily-level double bottom for a macro reversal, or prints a double top (lower high) for further continuation down.
③ H&S Completion & Deep Pullback
A decisive break below the 4,220 neckline confirms the H&S pattern. In this bearish case, we anticipate strong selling momentum targeting a deep pullback toward the 3,435-3,280 zone.
■ Action Plan
This is a high-interest area for both retail pattern traders and institutional buyers. Maintain a neutral bias. Wait for clear confirmation—either strong reversal price action at the Neckline, or a decisive body-candle break below it—before executing.
This analysis is for educational purposes only and does not constitute financial advice. Always practice strict risk management.
kurutologic