
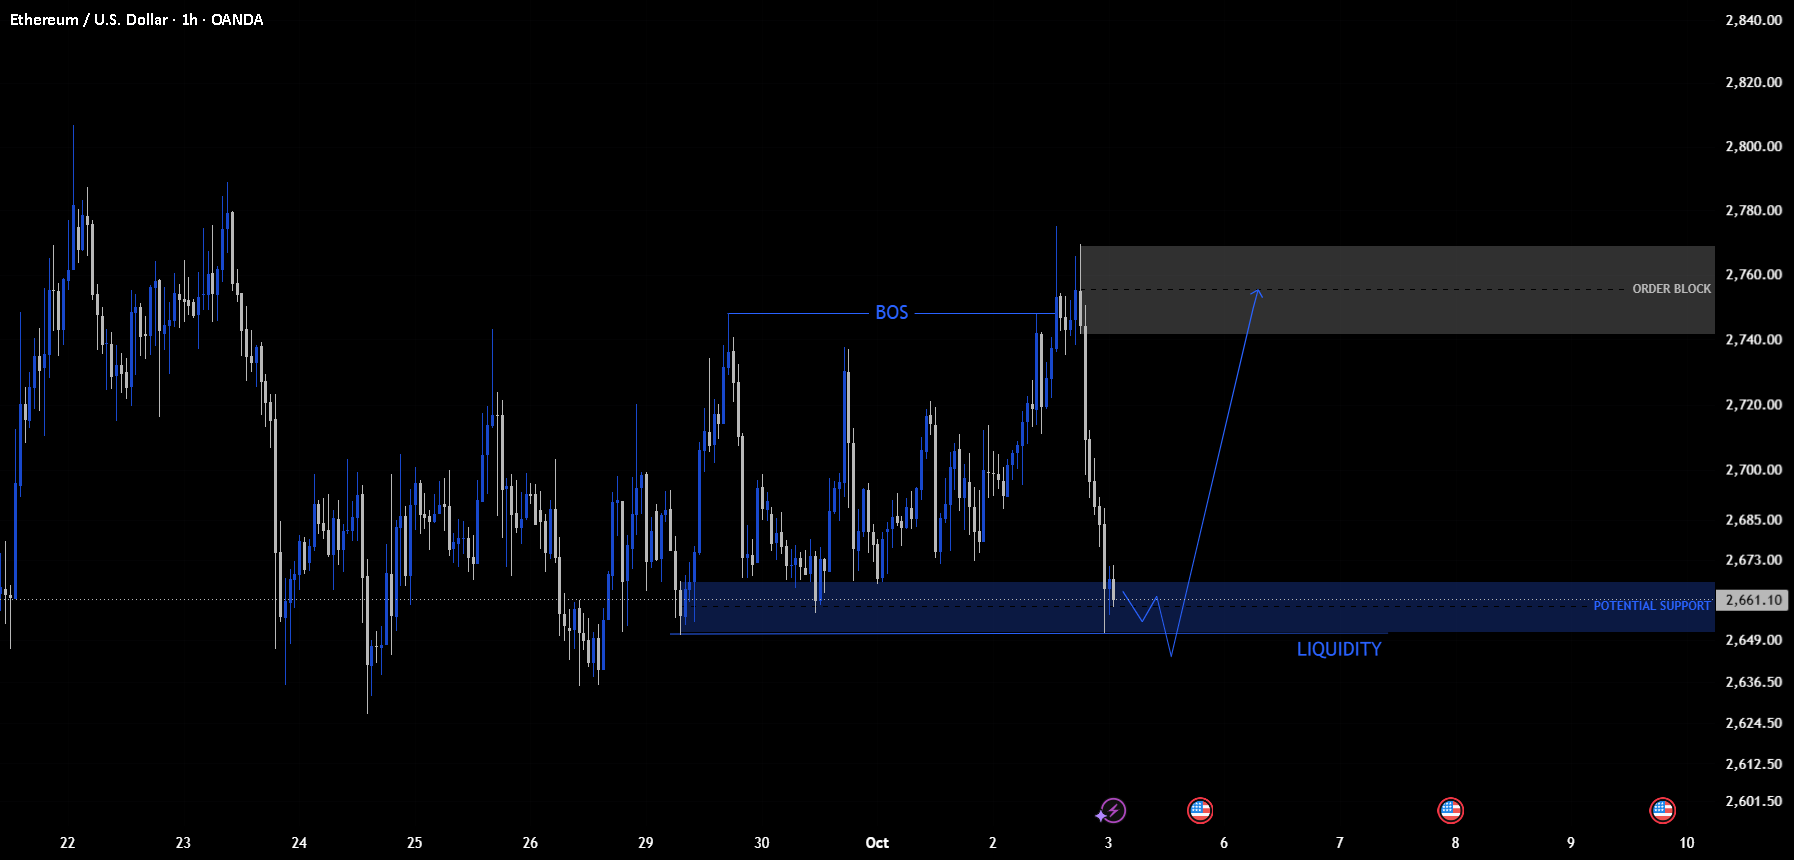
Price has established a bullish Break of Structure (BOS) after pushing above the previous swing high around the 2,740–2,750 area. This indicates a shift in short-term market structure and shows that buyers were able to overcome the previous resistance.
However, after reaching the 2,760–2,770 region, price showed a strong rejection and moved back toward the lower structure area.
Potential Support Zone
The highlighted 2,650–2,670 zone is an important area to monitor. It acted as a previous consolidation/interaction region and may now serve as a potential support area.
Rather than treating the zone as an automatic reversal point, the important factor is how price reacts when it reaches the area.
Liquidity
The chart also highlights liquidity below the current support area, around 2,640–2,650.
A temporary move below the support zone could represent a liquidity sweep, but confirmation would still be required through subsequent price action and structure.
Order Block
The highlighted 2,740–2,770 region represents the marked order-block area. Price has already interacted with this zone and rejected from it, making it an important area for future price-action analysis.
Educational Takeaway
The key lesson here is that BOS, liquidity and zones should be analyzed together rather than in isolation.
A structured approach is:
BOS → Identify key zone → Monitor liquidity → Observe reaction → Confirm structure
The zones shown on the chart are areas of interest, not guaranteed reversal or entry points. Price can react, consolidate, or invalidate the structure depending on future market conditions.
Educational content only. Not financial advice. Always manage risk independently.