
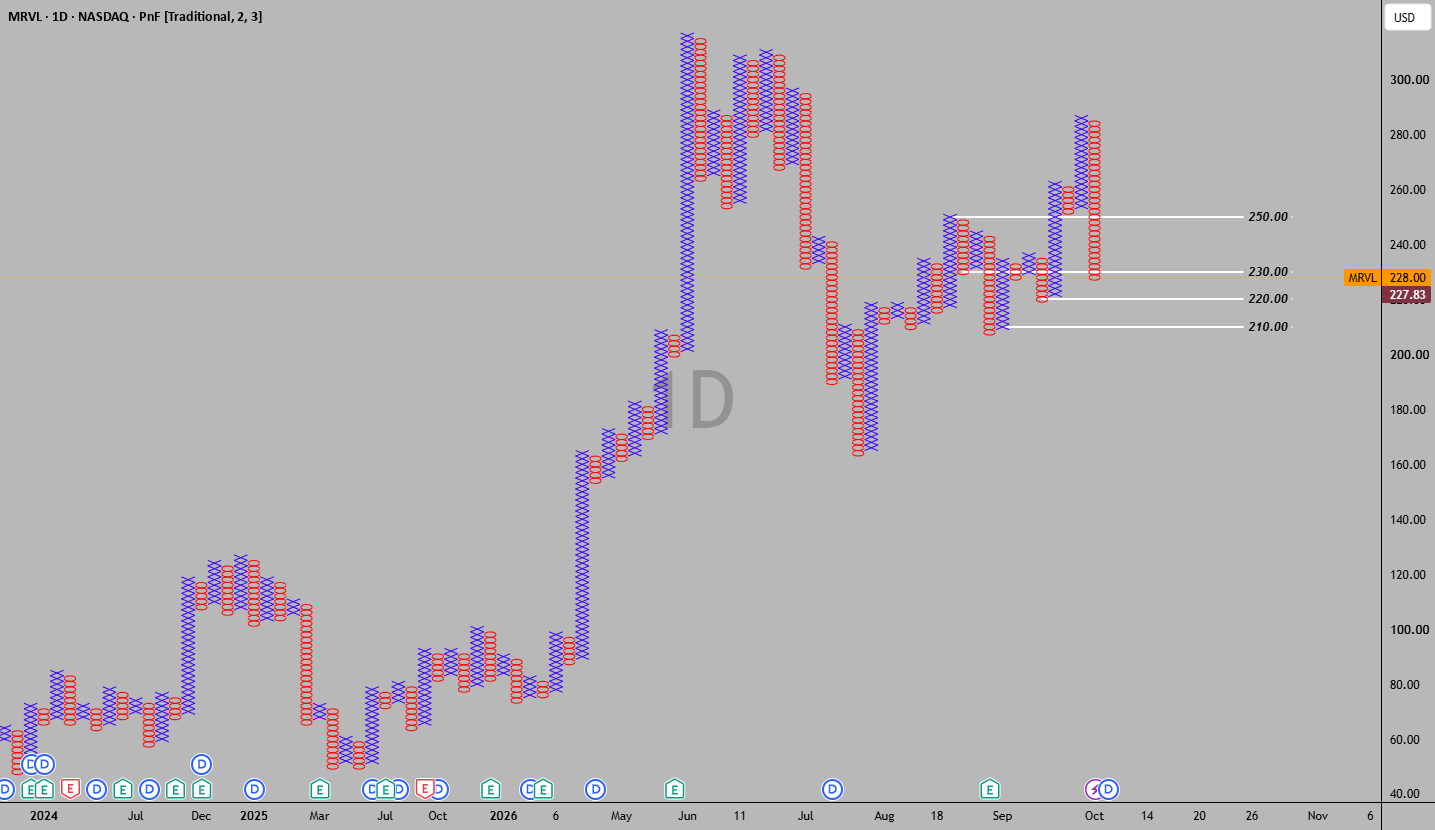
Analysis of Marvell stock using a Point & Figure (P&F) chart with the following settings:
1D / Traditional / 2-box reversal / Close-based.
Last closing price: $227.83.
Current reading: A clear negative shift following a failed attempt to rally near $287, resulting in a descending ‘O’ column that has extended down to the $228 box.
Crucially, the decline has breached the low of the previous ‘O’ column (near $252). In P&F charting, this constitutes a “Double Bottom Breakdown”—a signal of continued downward momentum rather than a reversal pattern. This favors the sellers, even though the broader historical trend remains bullish.
The outlook is bearish as long as the stock remains below the $230–$250 range.
$230 is the first level that must be reclaimed to initiate a recovery, while the $250 area serves as the technical confirmation level for a sustained recovery—a scenario that currently appears less likely.
Conversely, continued weakness—testing $220, followed by the $208–$210 range—is the more probable outcome.
For now, any rally occurring before the $250 level is reclaimed should be viewed as a corrective bounce rather than a confirmed recovery.
This analysis utilizes classic P&F methodology:
1. Breaking a previous low to trigger a sell signal.
2. Identifying horizontal support and resistance zones.
3. Recognizing technical patterns (excluding vertical counts).
Conclusion: The sell signal remains active. The first sign of improvement would be the formation of a new ‘X’ column followed by the recovery of resistance levels—simply seeing the ‘O’ column stop its descent is not enough.
Therefore, we are monitoring the $220 and $210 levels on the downside, while keeping $250 as a key benchmark for the strength of any potential recovery.