
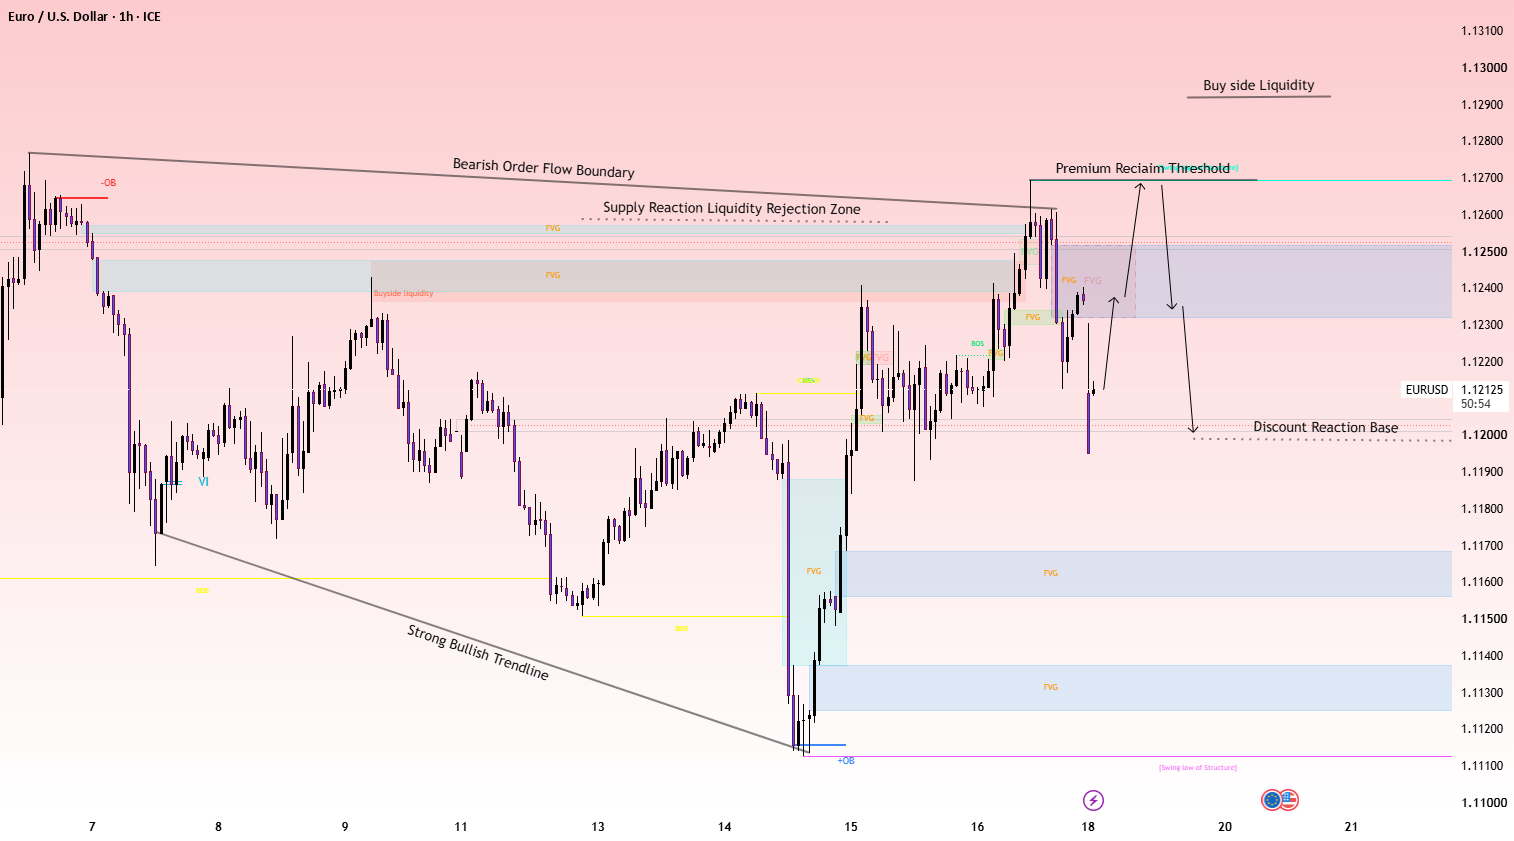
### EURUSD 1H – Smart Money Concepts (SMC) Market Structure Analysis
**Market Overview**
EURUSD is approaching an important decision area on the 1-hour chart. Price recently advanced from the strong-low region near 1.1110 and rallied toward the supply and liquidity zone around 1.1250–1.1270. However, the latest reaction shows rejection from this overhead area, followed by a sharp bearish move.
The main focus of this analysis is to observe how price reacts around the supply zone, bearish order-flow boundary, premium reclaim threshold, and discount reaction base. These levels may help identify whether the recent rally can continue or whether sellers regain control.
This is a conditional technical analysis, not a prediction of guaranteed price movement.
### 1. Bearish Order-Flow Boundary
The descending trendline represents the broader bearish order-flow boundary marked on the chart. Price has approached this boundary during its recent recovery, but the reaction near resistance suggests that bullish momentum may be facing difficulty.
**Reasoning:** A rally into descending resistance can attract selling interest, particularly when it overlaps with a supply zone or previous reaction highs. However, a trendline touch alone is not sufficient confirmation of a bearish continuation.
For stronger confirmation, traders can monitor lower-timeframe bearish market structure, a rejection candle, or a break below a recent reaction low.
### 2. Supply Reaction and Liquidity Rejection Zone
The highlighted supply region around 1.1240–1.1260 is an important area to monitor, with the upper resistance threshold extending toward approximately 1.1270.
Price pushed into this region before reversing sharply. This reaction indicates that the area deserves attention, although it does not independently prove institutional selling or confirm that the high will hold.
**What to watch:**
– A rejection followed by a lower high could support a bearish continuation scenario.
– A sustained move above the supply zone could weaken the immediate bearish interpretation.
– A breakout followed by a successful retest may indicate a shift in short-term momentum.
### 3. Premium Reclaim Threshold – Around 1.1270
The chart identifies approximately 1.1270 as the premium reclaim threshold. This is a key reference for evaluating whether buyers can overcome the current overhead resistance.
If price reclaims this level and holds above it with convincing bullish structure, the bearish setup would require reassessment. A brief wick above the level, without sustained acceptance, would be less conclusive.
The level should therefore be assessed through candle closes, retests, and the surrounding market structure rather than treated as an automatic buy or sell signal.
### 4. Fair Value Gaps (FVGs) and Overhead Supply
The marked Fair Value Gap regions highlight areas where price moved rapidly and where traders may watch for a possible revisit or reaction.
The nearby FVG and supply areas around 1.1230–1.1250 are particularly relevant because they overlap with the broader resistance structure.
**Reasoning:** An FVG can act as a potential reaction area, but not every gap is filled, and not every revisit produces a reversal. The reaction should be evaluated alongside momentum, candle closes, and market structure.
### 5. Discount Reaction Base – Around 1.1200
The chart marks the area around 1.1200 as the discount reaction base. Following the sharp rejection from overhead resistance, this level becomes an important reference for near-term price behavior.
If price revisits this area and forms a clear bullish reaction, a temporary recovery may develop. If price breaks below it and fails to reclaim it, downside continuation becomes a scenario worth monitoring.
A clean break and retest would provide more information than a single touch of the level.
### 6. Lower Demand and Support Zones
The blue support regions around 1.1155–1.1167 and 1.1125–1.1138 mark additional potential demand or imbalance areas on the chart. The strong low near 1.1110 is another important structural reference.
These zones may become relevant if sellers maintain control and price moves below the discount reaction base.
They should be treated as areas to observe, not guaranteed downside targets. A bullish response from these zones could interrupt the bearish sequence or produce a broader recovery.
### 7. Bullish and Bearish Scenarios
**Bearish continuation scenario**
If price remains below the overhead supply zone, forms a lower high, and confirms bearish market structure, sellers may attempt to push price toward the 1.1200 reaction base. A confirmed break below that level could bring the lower marked support zones into focus.
**Bullish recovery scenario**
If price reclaims the nearby resistance and establishes sustained acceptance above the supply region, the current bearish interpretation would weaken. A stronger reclaim toward 1.1270, supported by bullish structure and a successful retest, would provide additional evidence of a potential recovery.
Neither scenario is confirmed in advance. Price action must determine which structure develops.
### 8. Risk Management and Invalidation
Before considering any trade, traders should define their entry conditions, stop-loss placement, risk-to-reward expectations, and invalidation criteria.
For a bearish interpretation, sustained acceptance above the relevant resistance structure would be a reason to reassess the setup. For a bullish interpretation, failure to hold reclaimed support or a fresh bearish structure break would weaken the recovery case.
Avoid entering solely because price touches a marked zone. Consider spread, volatility, position sizing, and upcoming economic releases.
### Conclusion
EURUSD is reacting to an important overhead supply and resistance region after recovering from the 1.1110 area. The recent rejection makes the 1.1200 reaction base an important near-term reference, while the lower demand zones and the 1.1270 reclaim threshold provide broader structural context.
The key question is whether sellers can maintain pressure below resistance or buyers can reclaim the overhead structure. Waiting for confirmation, managing risk, and remaining open to either outcome are more important than anticipating a guaranteed direction.
**Educational purpose only:** This chart analysis is intended to explain market structure, liquidity concepts, supply and demand, and Fair Value Gaps. It is not financial advice or a guarantee of future price movement.