
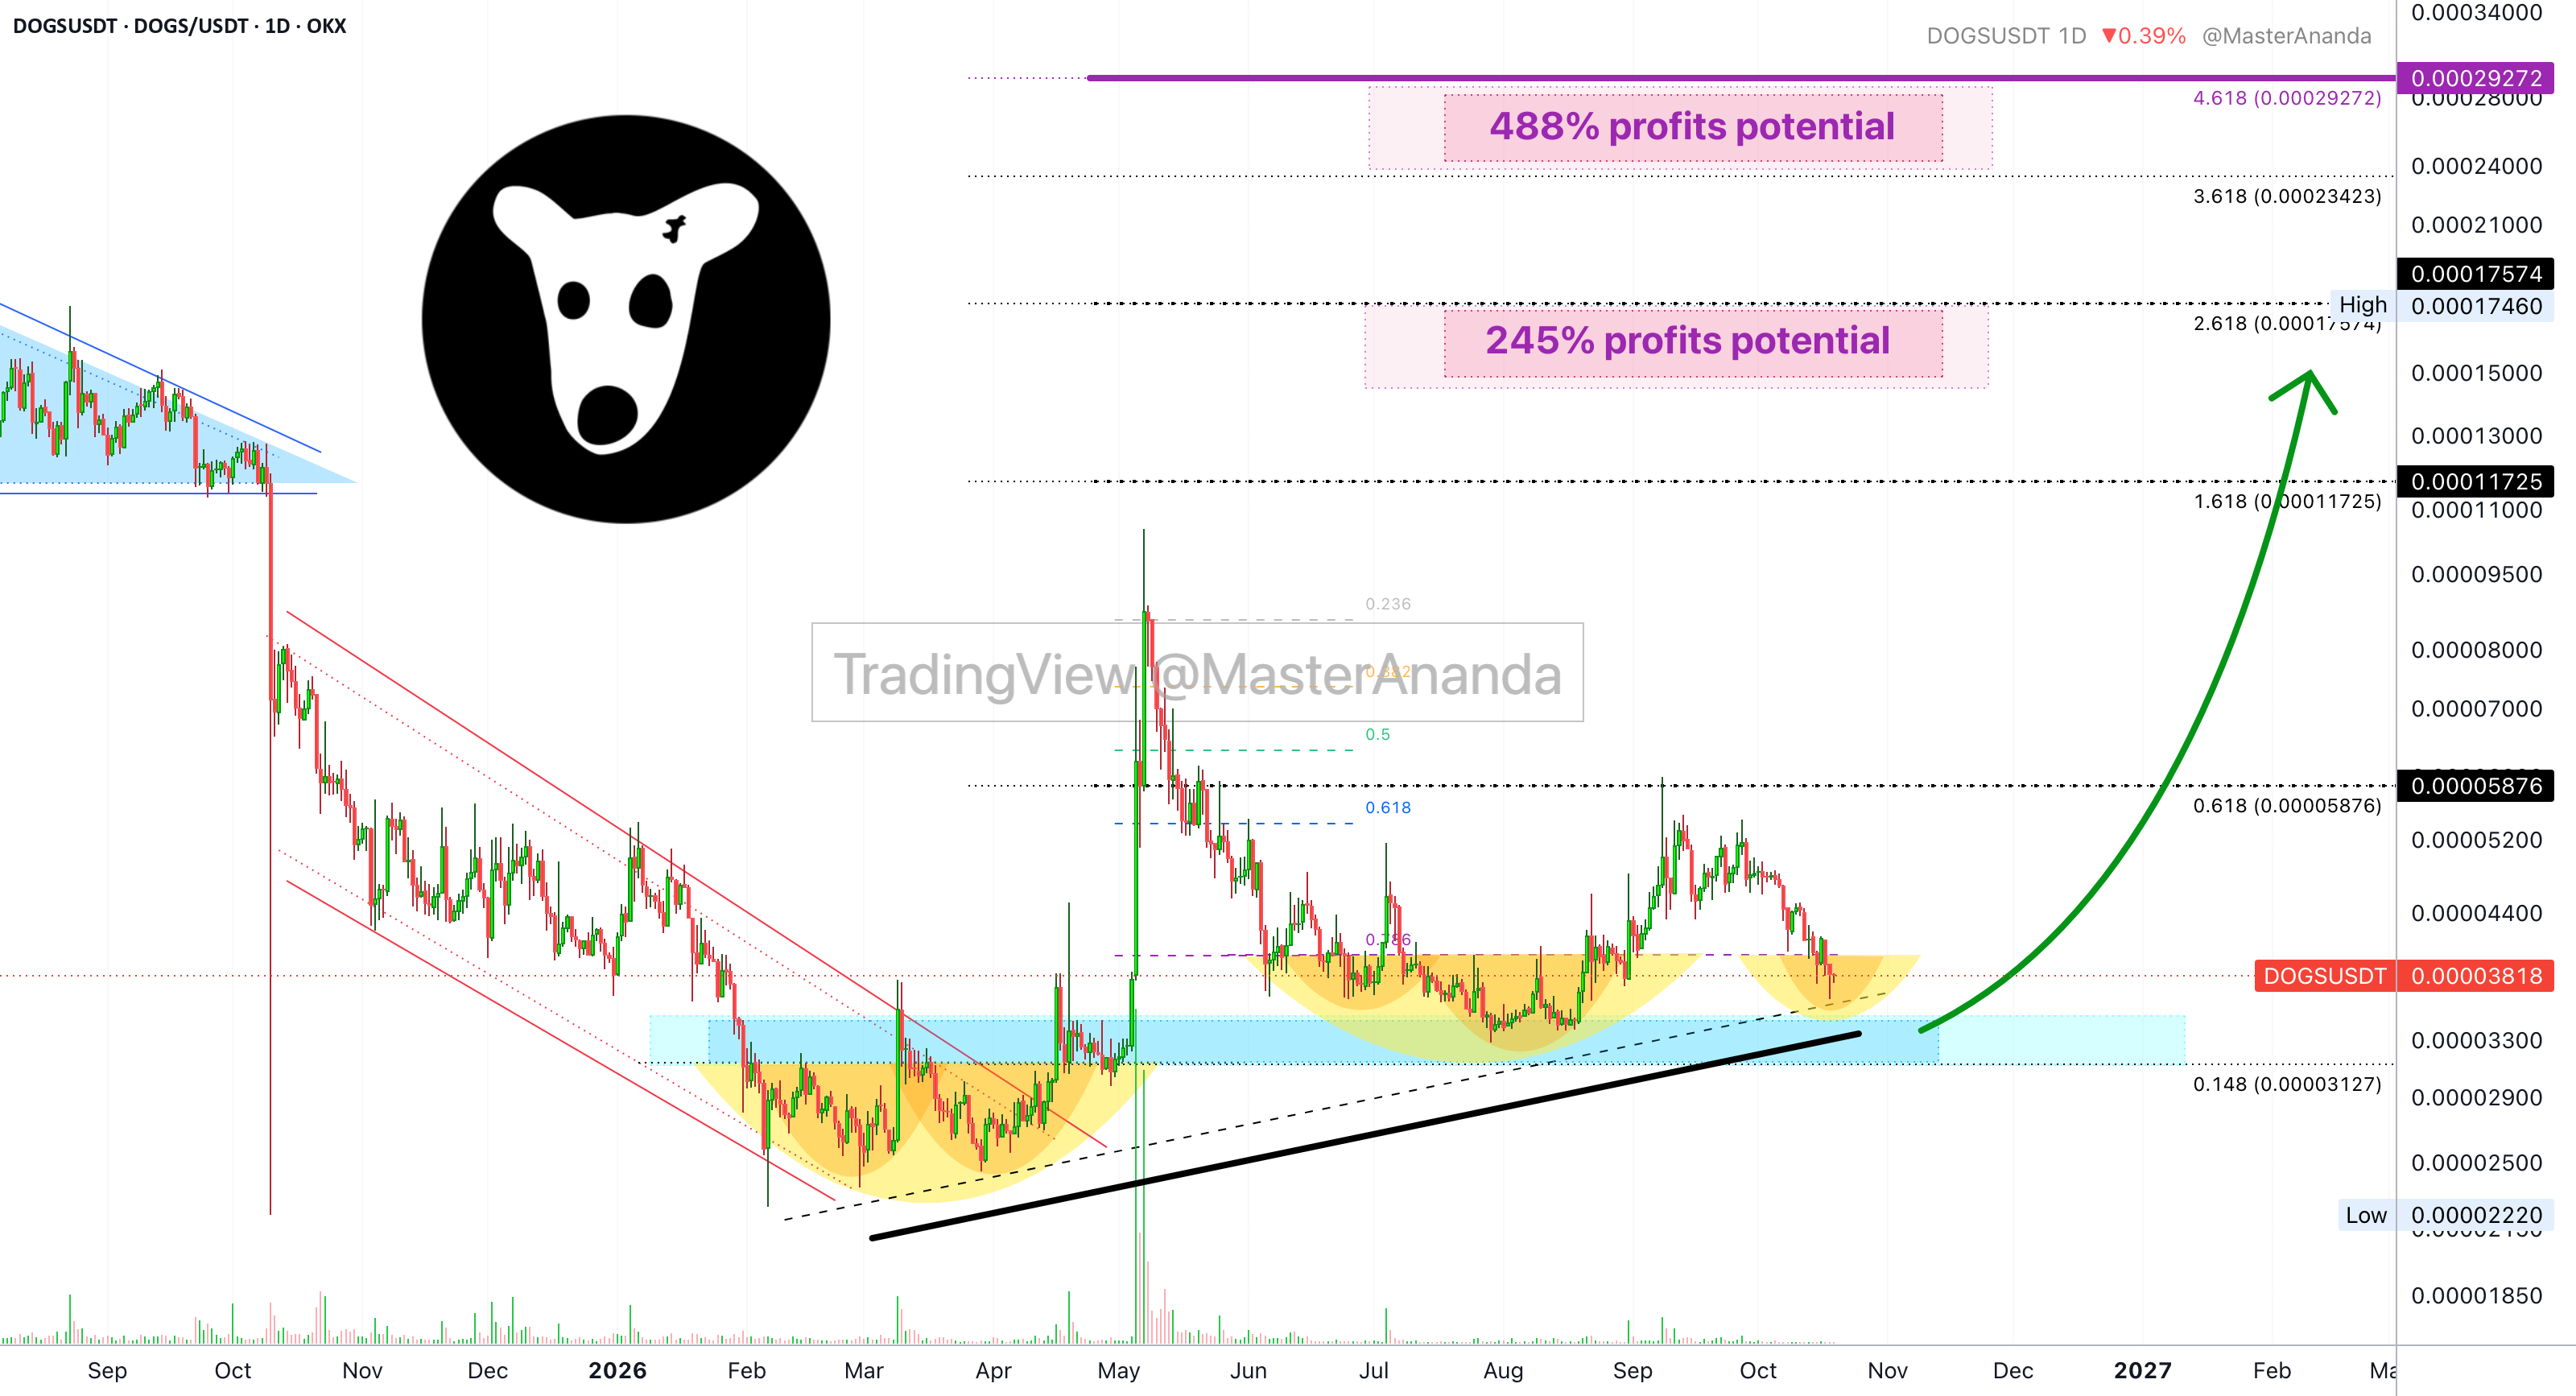
DOGSUSDT is in a great position if you are a buyer, the chart looks great. The trend here is a rising bottom, the black line on the chart. This sequence of higher lows is what reveals to us the market direction, it is pretty neat.
The all-time low happened October 2025 and after February we have a rising base. The high-volume jump shows the propensity of the market, the tendency and the direction in which momentum is aiming—up.
Notice there are many red candles but there is no sense of a bearish cycle or period, there is no sense of a continuation of the current bearish move (a retrace) developing into a correction, hitting multiple lower lows and then lower… I just don’t see it happening but somehow it keeps on popping up. The more it pops up the easier it becomes to ignore.
When the market is about to make a move, it is never so certain, there is always some sort of catch especially when the accumulation period is an extended one. There can be some sort of flush or shakeout before the marketwide advance. Something always shows up and we can prepare by choosing to buy only those red like DOGSUSDT on this chart.
Retrace and lower high, months of bearish action, since May 2026 but with a bullish chart. Five months of bearish action? We are getting close to a re-entry. This chart setup offers the opportunity for new LONGs.
The choice is yours.
Namaste.