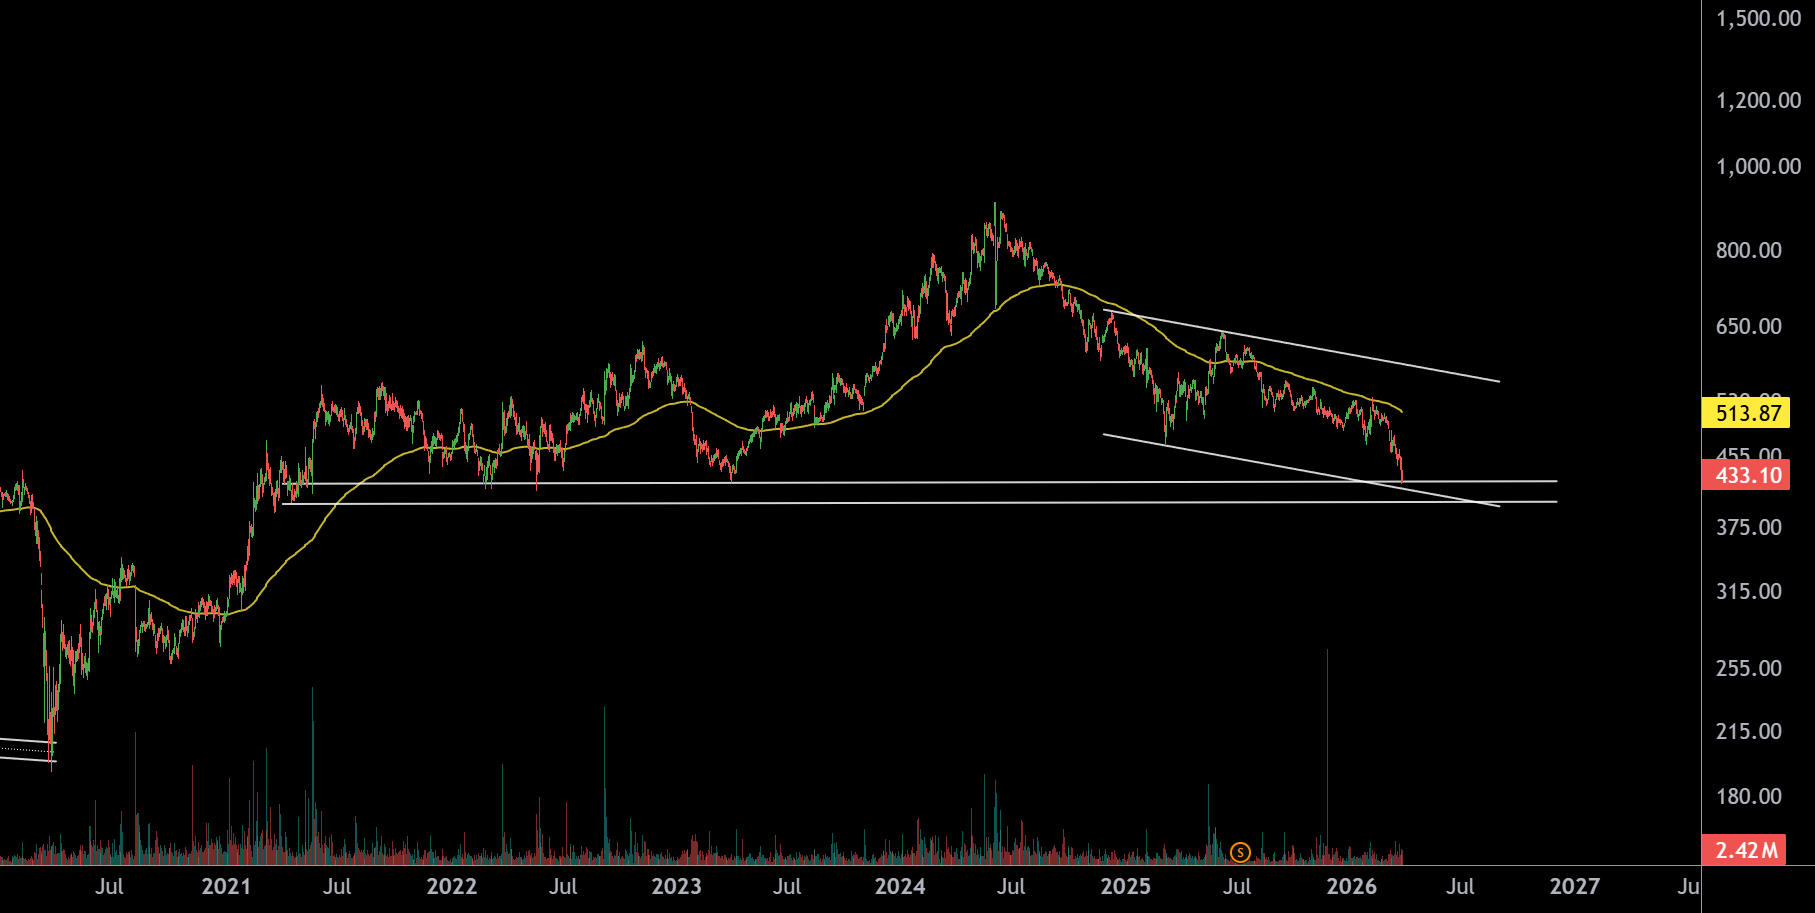
CONCOR – Daily Timeframe Analysis
This is the daily timeframe chart of CONCOR. The stock is currently trading near a strong support zone around 400–420, based on the Fibonacci retracement levels.
The price is also moving within a falling channel, with additional support seen near the 400–410 area.
A minimum upside target of 500 is possible. However, the price is currently trading below the EMA, which indicates weakness. Even if a reversal occurs, the price may first retest the EMA and then face selling pressure again.
If the support holds, we can expect a move from 400 to 500.