
A few weeks ago, Bloom Energy (BE) walked up to the earnings table as a company half of Wall Street had written off as a cash-burning science project.
It walked away as one of the most important names in the entire AI buildout.
Here is what happened.
Every tech giant on earth is racing to build data centers for AI, and they have all slammed into the same wall.
There is not enough power. The grid cannot come close to feeding what these things need, and it is the single biggest bottleneck in the whole AI race.
Bloom is the answer.
It makes fuel cells that generate electricity right on site, no waiting years for the grid to catch up, and that earnings report was the proof the orders are real.
Oracle expanded its deal to have Bloom power entire AI campuses. Nebius signed on for billions. The backlog is now north of $20 billion.
And the numbers backed every bit of it.
Revenue jumped 130% to $751 million, crushing estimates by more than $200 million. The company that was supposed to be losing money turned a profit and raised its guidance on the way out.
The stock gapped to a new high and never looked back.
Why the chart matters as much as the headline
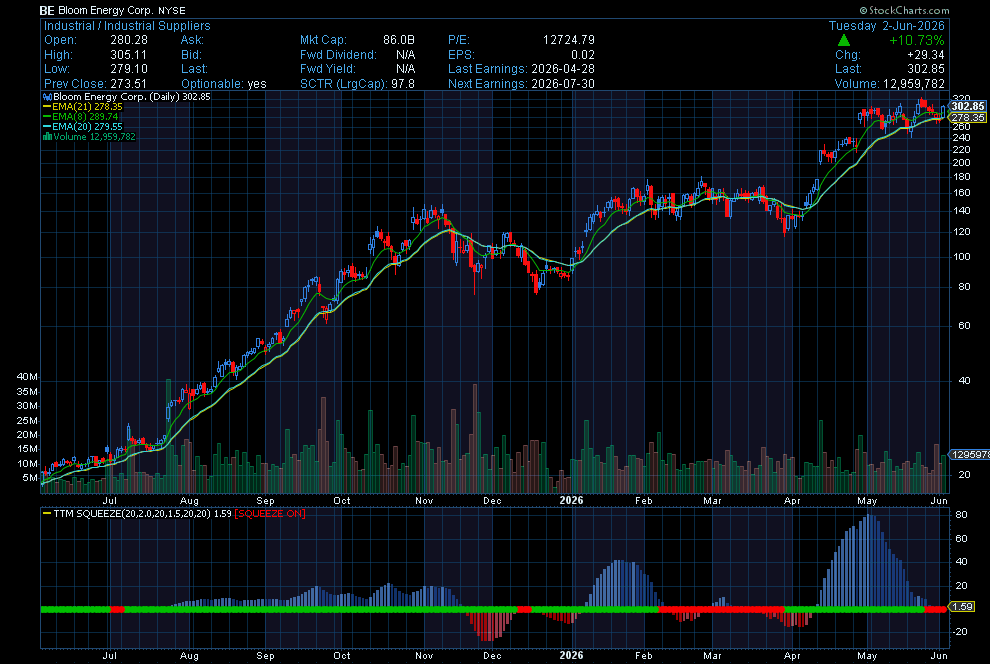
The reaction to earnings is what put Bloom on my radar.
What keeps it there is the chart, because it lines up with one of my favorite setups, the kind that fits my TPS framework: trend, pattern, and squeeze all stacking up on the same name.
Bloom has all three.
Start with the trend, because nothing else matters without it.
BE has its EMAs stacked on the daily and the weekly. Short above long, price above both, every line fanned out and pointing higher on two timeframes at once.
That is not a stock running out of gas after a big year.
It is under heavy accumulation, and the weekly stack says the big money is in for the long haul, not flipping it next week.
Then the pattern. After that earnings gap, BE did not give it all back, and it did not blow off. It went sideways and digested the move, building a tight base right up at the highs instead of rolling over.
A stock that holds its gains calmly is a stock that wants to go higher.
The part I care about most
Sitting right on top of all of it is the squeeze.
Volatility on the daily has wound down tight, and the bands are pinching in, and this is the piece that gets my attention. A squeeze is a coiled spring. A squeeze on a name already trending this hard, with a story this big underneath it, is a spring loaded with weight on it.
When it releases, the move out can be fast and it can be violent.
That is the whole package.
A real business with real revenue, a chart trending on two timeframes, a clean base, and a squeeze ready to fire.
I do not find all four on the same name very often, and when I do, it goes on the watchlist and it stays there until it moves.
Your Action Plan
I’ve given you all my reasons why this is a worthy setup. I’m not in the trade yet, but if I do decide to pull the trigger, it will be in the Daily Profits Live Room.
Bloom is just one name on my list. I’m tracking several others every morning, and I do my training and coaching right there in the room too.