
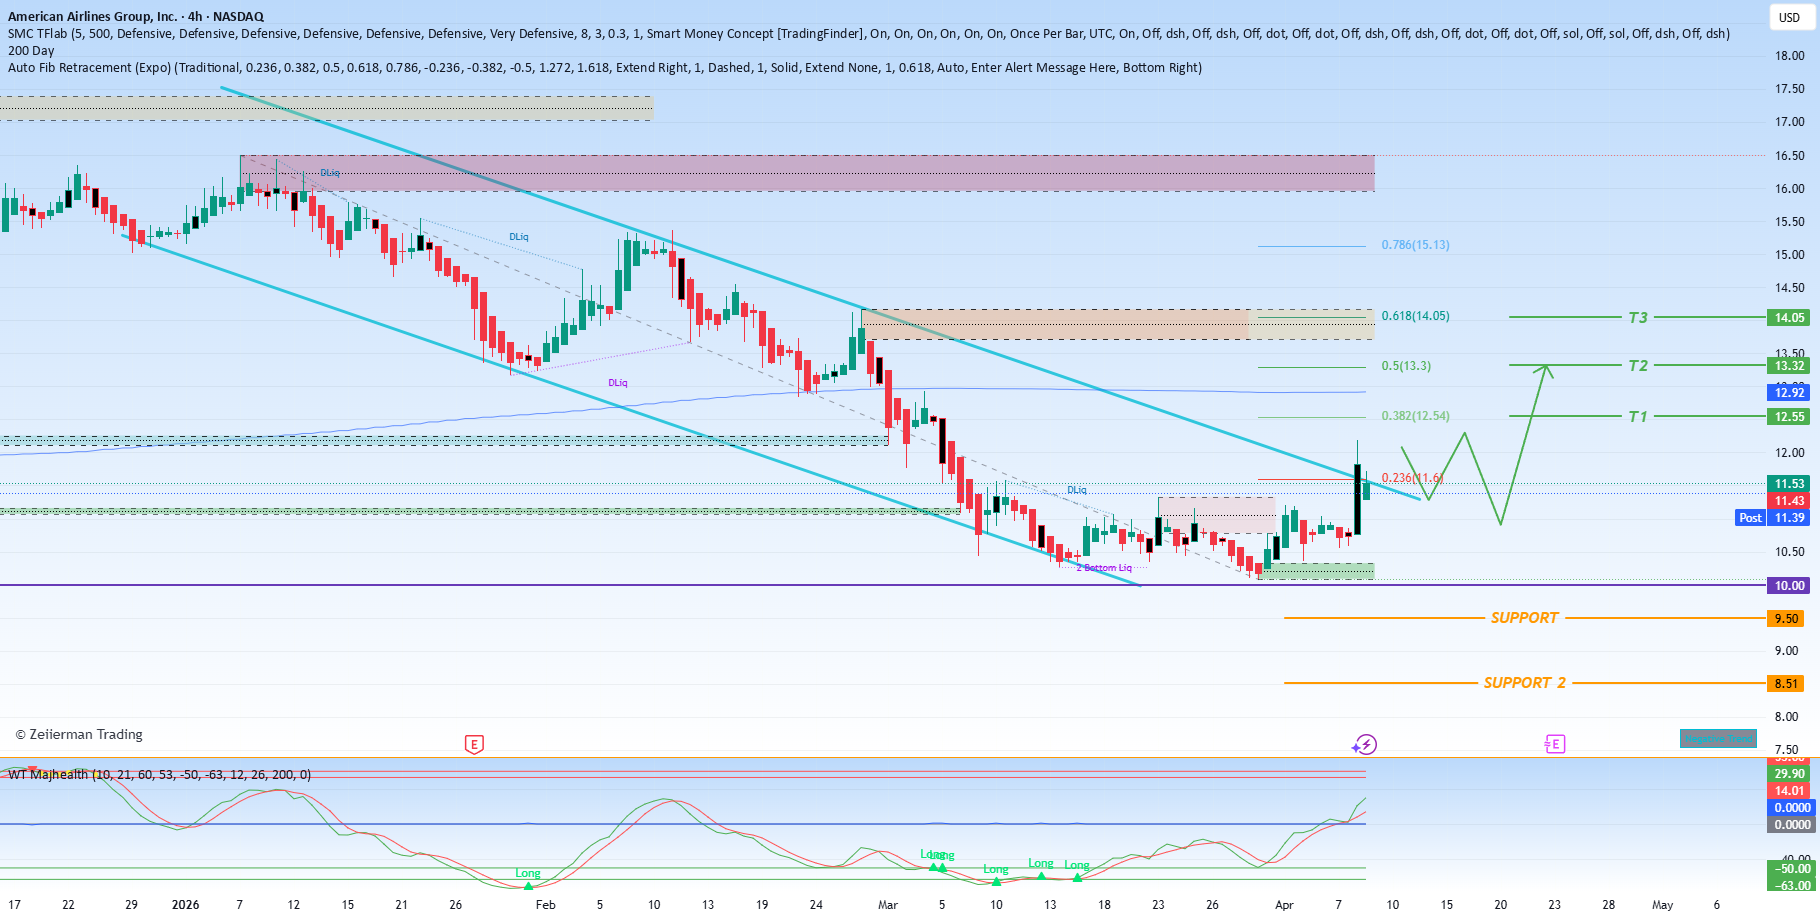
American Airlines Group Inc. (NASDAQ: AAL) Stock Jumps 9.3% – Can the Momentum Hold?
Shares of American Airlines Group Inc. (NASDAQ: AAL) are trading sharply higher today, rising 9.3% to reach $11.82. This impressive single-day surge puts the airline on track to record its best daily performance since August 12. The rally is being driven by a combination of positive external factors, including a halo effect from Delta Air Lines’ (DAL) outstanding first-quarter earnings report, which has lifted sentiment across the entire airline sector.
In addition to Delta’s strong results, American Airlines is also benefiting from a decline in oil prices. Crude prices have eased in response to news of a two-week ceasefire agreement between the United States and Iran, reducing one of the major cost pressures for airlines. Lower fuel costs typically translate directly into improved profitability for carriers, making this a significant tailwind for AAL and its peers.
Technical Breakout and Key Price Levels
From a technical perspective, today’s breakout has allowed American Airlines to clear a narrow trading range that had persisted over the past month. The stock had been testing the overhead resistance level at $12, and while it has not yet decisively broken through that ceiling, the current price action suggests growing bullish momentum. It is worth noting that despite today’s sharp gains, AAL remains down 22% so far in 2026. However, looking at a longer time horizon, the stock is up 31% over the last 12 months, indicating that longer-term holders have still seen substantial appreciation.
Short Squeeze Potential Could Fuel Further Gains
One factor that could continue to support the stock in the near term is the potential for a short squeeze. Short interest in American Airlines has increased by 25.4% over the two most recent reporting periods, signaling that bearish bets have been accumulating. Currently, there are 56.41 million shares sold short, which accounts for 8.7% of the stock’s total available float. If the share price continues to rise, short sellers may be forced to cover their positions by buying back shares, which could add further upward pressure and extend the rally.
Options Activity Heats Up – Calls Dominate Trading
Options market activity also reflects strong bullish sentiment today. Calls are trading in unusually high volume, with 72,000 call contracts having changed hands as of the last check. This level of call volume is five times the average intraday amount, highlighting a dramatic spike in bullish betting. Furthermore, call volume is more than double the number of put contracts traded, indicating that traders are overwhelmingly positioning for additional upside.
The most actively traded option so far has been the weekly 4/10 11-strike call, suggesting that many traders are betting on the stock remaining above $11 by expiration. At the same time, new positions are being opened at the weekly 4/10 11.50-strike put, which could reflect either hedging activity or more cautious bets that the stock may face resistance near the $11.50 level.
Looking Ahead
With strong sector sentiment, falling fuel prices, a technical breakout, and elevated call volume, American Airlines appears to have multiple tailwinds supporting its current rally. However, investors will want to monitor whether the stock can sustain this momentum and eventually break through the $12 resistance level, as well as keep an eye on any developments in oil prices or geopolitical tensions that could reverse today’s gains.