
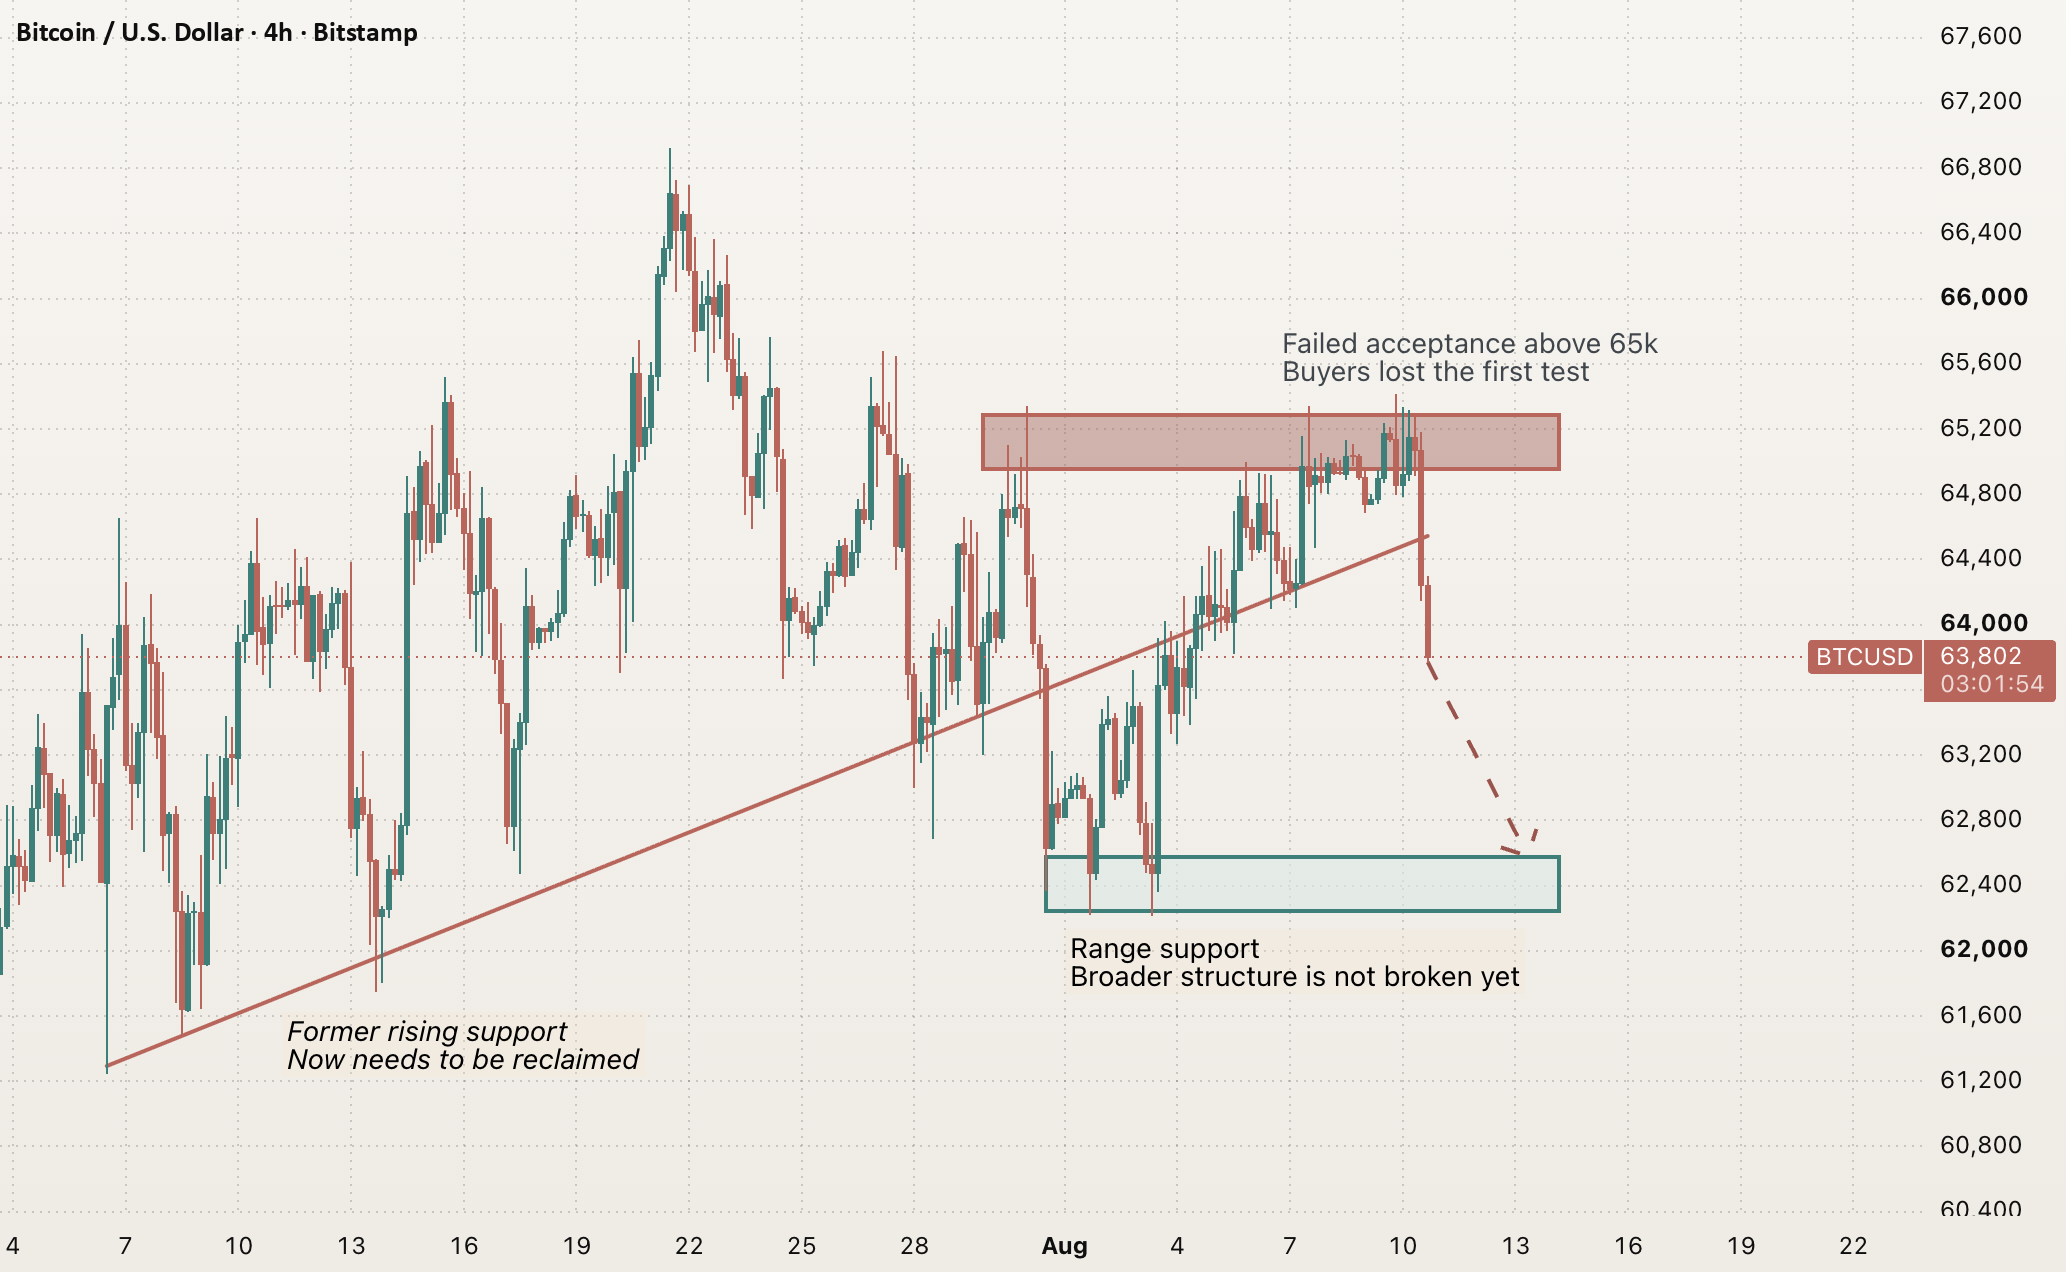
Bitcoin has lost the rising structure that supported most of the early-August recovery.
Technically, that matters.
Price repeatedly failed to establish acceptance above the 64,900–65,300 area and has now broken beneath the ascending support line on the four-hour chart. The first bullish structure has failed.
But the broader story is less bearish than the chart alone suggests.
Crypto investment products have seen a meaningful improvement in flows over the past week. Recent reporting points to roughly $1.1 billion of combined inflows into U.S. spot Bitcoin and Ether ETFs, even as Bitcoin struggles to hold the 65,000 area. That suggests institutional demand has improved faster than price confirmation.
The contradiction is important because ETF outflows were one of the strongest arguments against Bitcoin earlier this year. Citigroup cut its Bitcoin outlook in July partly because ETF flows had turned negative and broader adoption was failing to generate a new catalyst.
Now flows are recovering, but price has just broken its short-term structure.
What the chart shows
The 64,900–65,300 area rejected several attempts to move higher.
After that failure, Bitcoin broke below the ascending trendline and returned toward 63,800. That shifts the short-term structure back in favour of sellers.
However, the 62,300–62,600 area remains intact.
That zone stopped the previous decline and still separates a failed short-term pattern from a broader breakdown.
Primary interpretation
The bearish interpretation has gained weight after the trendline break.
It becomes more credible if Bitcoin fails to reclaim the broken structure and continues accepting prices below 64,000. In that case, a retest of the lower range would be consistent with the technical damage already visible.
The key distinction is that support near 62,500 has not failed yet.
Alternative interpretation
The alternative is that the breakdown becomes a failed move.
That scenario gains credibility if Bitcoin quickly recovers the former rising support and then returns above 65,000. Improving ETF demand would make such a recovery more meaningful because the flow backdrop would finally receive price confirmation.
Until then, institutional demand and price structure are pointing in different directions.
What would change the current view
The bearish reading would weaken after sustained four-hour acceptance back above the broken trendline and 65,000.
The broader neutral structure would fail if Bitcoin loses the 62,300–62,600 area and cannot reclaim it.
What comes next
The next major macro catalyst is the July U.S. CPI report on August 12. The Federal Reserve kept rates at 3.50%–3.75% in July, so another inflation surprise could materially change expectations around the next policy move.
Bitcoin has lost the technical pattern, but the institutional bid has not disappeared with it.