
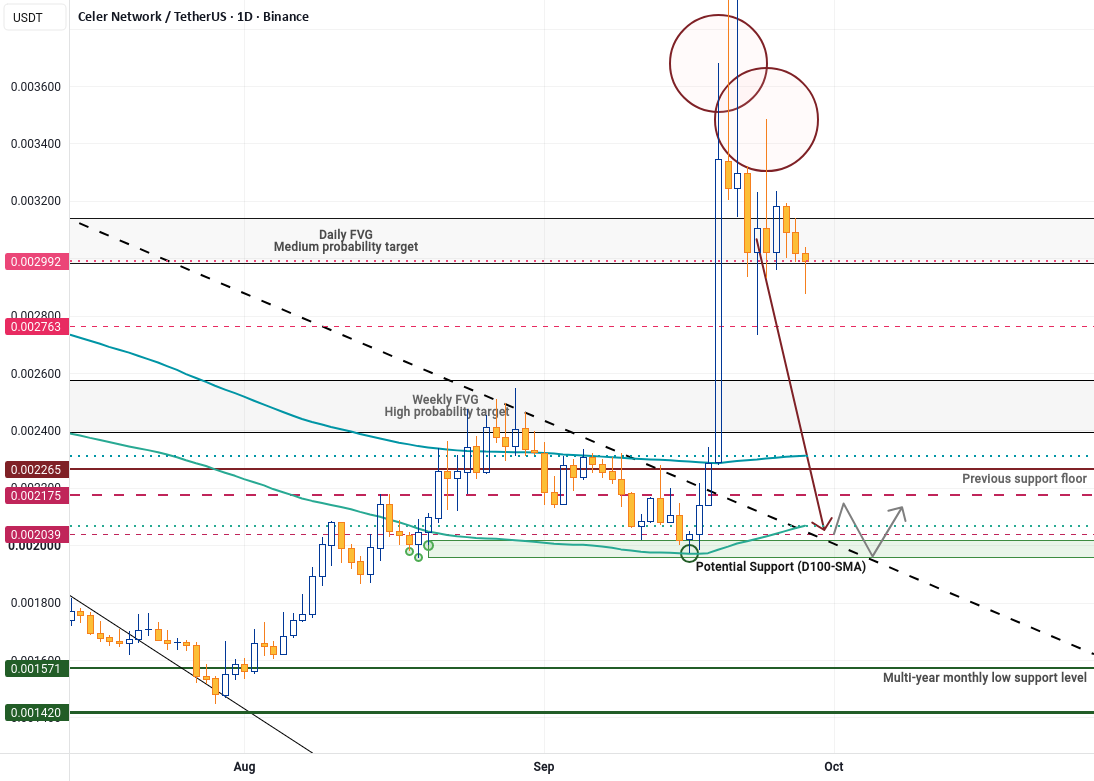
The Celer Network token (CELR) spent the past week undergoing heavy distribution on the spot market around the former Medium Probability Target Area (MPTA), which capped continuation to the upside. Daily volume ranged from 500M to 950M tokens (6–11% of circulating supply) before cooling back down to the usual 100M–250M range. Futures markets saw expected short squeezes, which late buyers trapped near the top used as exit opportunities.
The Road Ahead
Further downside continuation is expected once the current support floor breaks, given that range volume has declined and risks from an overheated crypto market spur caution. A retest of the downward-sloping trendline (dashed black line) on the weekly chart remains pending and is the base case, with expected touchpoints sitting around the D100-SMA (teal line) and brief downside deviations likely as holders capitulate.
Consequently, holding exposure to the token is not recommended for the time being; it is preferable to wait for a retest and consolidation above the D100-SMA range.
Externalities and Considerations
• BTC: Bitcoin’s price currently sits at the top of its range, with open interest matching levels from a year ago. With little liquidity remaining above current levels, a correction towards ~$72,500 is expected in the coming days. Timing is crucial: a correction occurring before the monthly close would be distinctly bearish, signaling an eventual decline towards the $55,000 region (on top of which sits the largest liquidation cluster left). Conversely, if it occurs after the October monthly candle opens, it may simply represent a sweep of the lows to form a local bottom. This correction could drive CELR’s price towards the D100-SMA or, if CELR is already in that region, extend its downside targets further.
• Geopolitics & Commodities: The US–Iran conflict remains on a slow escalation path, with discussions surrounding the UN General Assembly (UNGA) failing to yield even a temporary de-escalation. This suggests that oil prices could slowly crawl their way up towards $120–$130 before demand destruction eventually caps further gains. Should China resume purchases, oil prices could briefly spike towards $150 as trading desks front-run Chinese demand.
• Macro Outlook: Treasury yields have climbed significantly, with ‘bond vigilantes’ returning in full force as global central bank measures prove insufficient to curb inflationary pressures stemming from the US–Iran conflict and the AI investment boom. At the time of writing, the US 10-year Treasury yield sits at 5.25%, with a return to ~6% seen as a likely scenario for the first time in nearly three decades. This highlights a bearish environment for BTC and equities over the coming months as central banks move to restore credibility in bond markets.
Key Support Ranges:
1. Previous Support Floor & D200-SMA Area: $0.00215–$0.00230 (Unlikely)
2. Current Range Support & D100-SMA: $0.00190–$0.00205 (Most likely)
The current assessment for the token anticipates continued downside until price reaches the $0.00190–$0.00205 region.