
By analyzing the #Ethereum chart on the Daily timeframe, we can see that price has arrived exactly where we said the battle would be fought. In our previous idea, I mapped the Daily Flip Zone ($1,968.80 – $2,160.36) as the single region where the major reaction would happen — and price has now driven straight into the lower edge of that zone and started to react from it. You can revisit the original breakdown here: 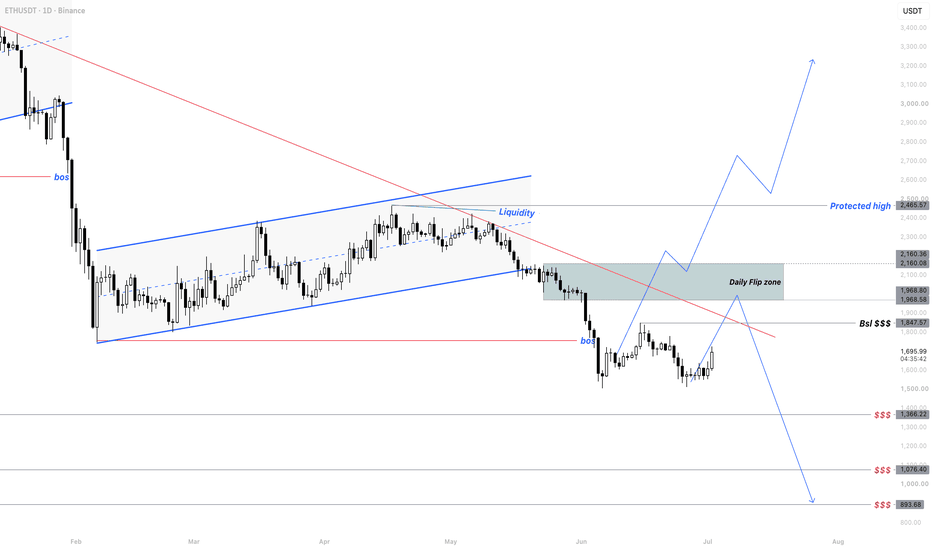
📊 Daily Timeframe
Let’s be clear about the context first: the higher timeframe trend has not changed. ETH is still trading inside a broader downtrend that was built on a bearish CHoCH followed by repeated bearish BOS on the way down. Every bullish argument on this chart has to fight against that structure — it hasn’t been repaired yet.
What has happened is that the corrective leg we called delivered in full. Price bottomed out, reclaimed the descending trendline that had capped it since the highs, and rallied all the way up into the Daily Flip Zone — tagging the lower boundary at $1,968.80 before getting pushed back. Price is now trading around $1,891.48, reacting off that zone exactly as scripted.
The map from here is simple and symmetrical. Overhead sits the rest of the zone up to $2,160.36, and above it the Protected High and resting Liquidity at $2,465.57. Below, the last real structural support is $1,801.27, and beneath that the chart opens into three untouched liquidity pools at $1,366.22, $1,076.40 and $893.68.
🎯 The Bias
This is a binary setup and I’d rather present it as one than pretend I know which way it breaks before the market tells me.
Scenario A — the base case (bearish). In my view, the path of least resistance is still lower, because nothing about the higher timeframe has been repaired. We have a bearish CHoCH, we have consecutive bearish BOS, and price is now rejecting from a premium zone after a corrective rally — that’s textbook continuation behaviour, not reversal behaviour. The confirmation I want is a decisive daily close below $1,801.27. That single close would confirm the rejection is real and put the deeper pools at $1,366.22, then $1,076.40, and ultimately $893.68 back on the table. Until that close prints, this is a plan, not a trade — don’t front-run it.
Scenario B — the flip (bullish). If price instead pushes back into the zone and produces a clean daily close above $2,160.36, the whole picture changes. That would be a genuine structural shift, not a bounce, and it would open the door directly to the Protected High at $2,465.57 where the liquidity is resting. That level is my invalidation, plainly stated: a decisive close above the flip zone kills the bearish thesis entirely.
The one rule that decides everything here: a break is a candle close, not a wick. This zone is exactly the kind of level where the market prints a long wick through it to grab stops before reversing. Wait for the close, in either direction, and don’t get faked out.
📰 Fundamental Backdrop
The fundamentals here are genuinely two-sided, and it’s worth saying so plainly rather than cherry-picking the half that supports the chart.
On the bullish side, US spot Ethereum ETFs have snapped an eight-week outflow streak and turned positive again — roughly $105m in the week of 13–17 July, their strongest weekly total since April, with renewed positive inflows continuing into the following week. That flow is the engine behind this entire July rally, and Standard Chartered’s Geoffrey Kendrick is still publicly holding a $7,500 year-end target on the back of ETH’s role in stablecoins and tokenised real-world assets.
On the other side, ETH still sits well beneath its 2025 peak near $4,780, the Fear & Greed Index remains parked in fear territory, and the widely watched 200-day moving average sits around $2,134 — directly beneath the top of our Daily Flip Zone. The technical wall and the macro wall are the same wall. Retail positioning is also lopsidedly long, with the majority of open ETH CFD positions at one major broker sitting on the buy side — crowded longs tend to make rejections sharper, not softer.
Then there’s the binary risk, and it’s stacked into this exact week. The FOMC meets 28–29 July, with consensus expecting a hold at 3.50%–3.75% but a meaningful minority still pricing a hike, followed by Chair Kevin Warsh’s press conference. Q2 GDP and June core PCE land on 30 July, and monthly ETH options and futures expire on Deribit and CME on 31 July, right at month-end. Four headline events landing while price sits on the most important level on the chart — size your risk accordingly.
This analysis will be updated as the market evolves. If this breakdown added value, drop a like 👍 and a comment 💬 to support the work — and share where you see Ethereum heading next! Best Regards, BigBeluga 🐳