
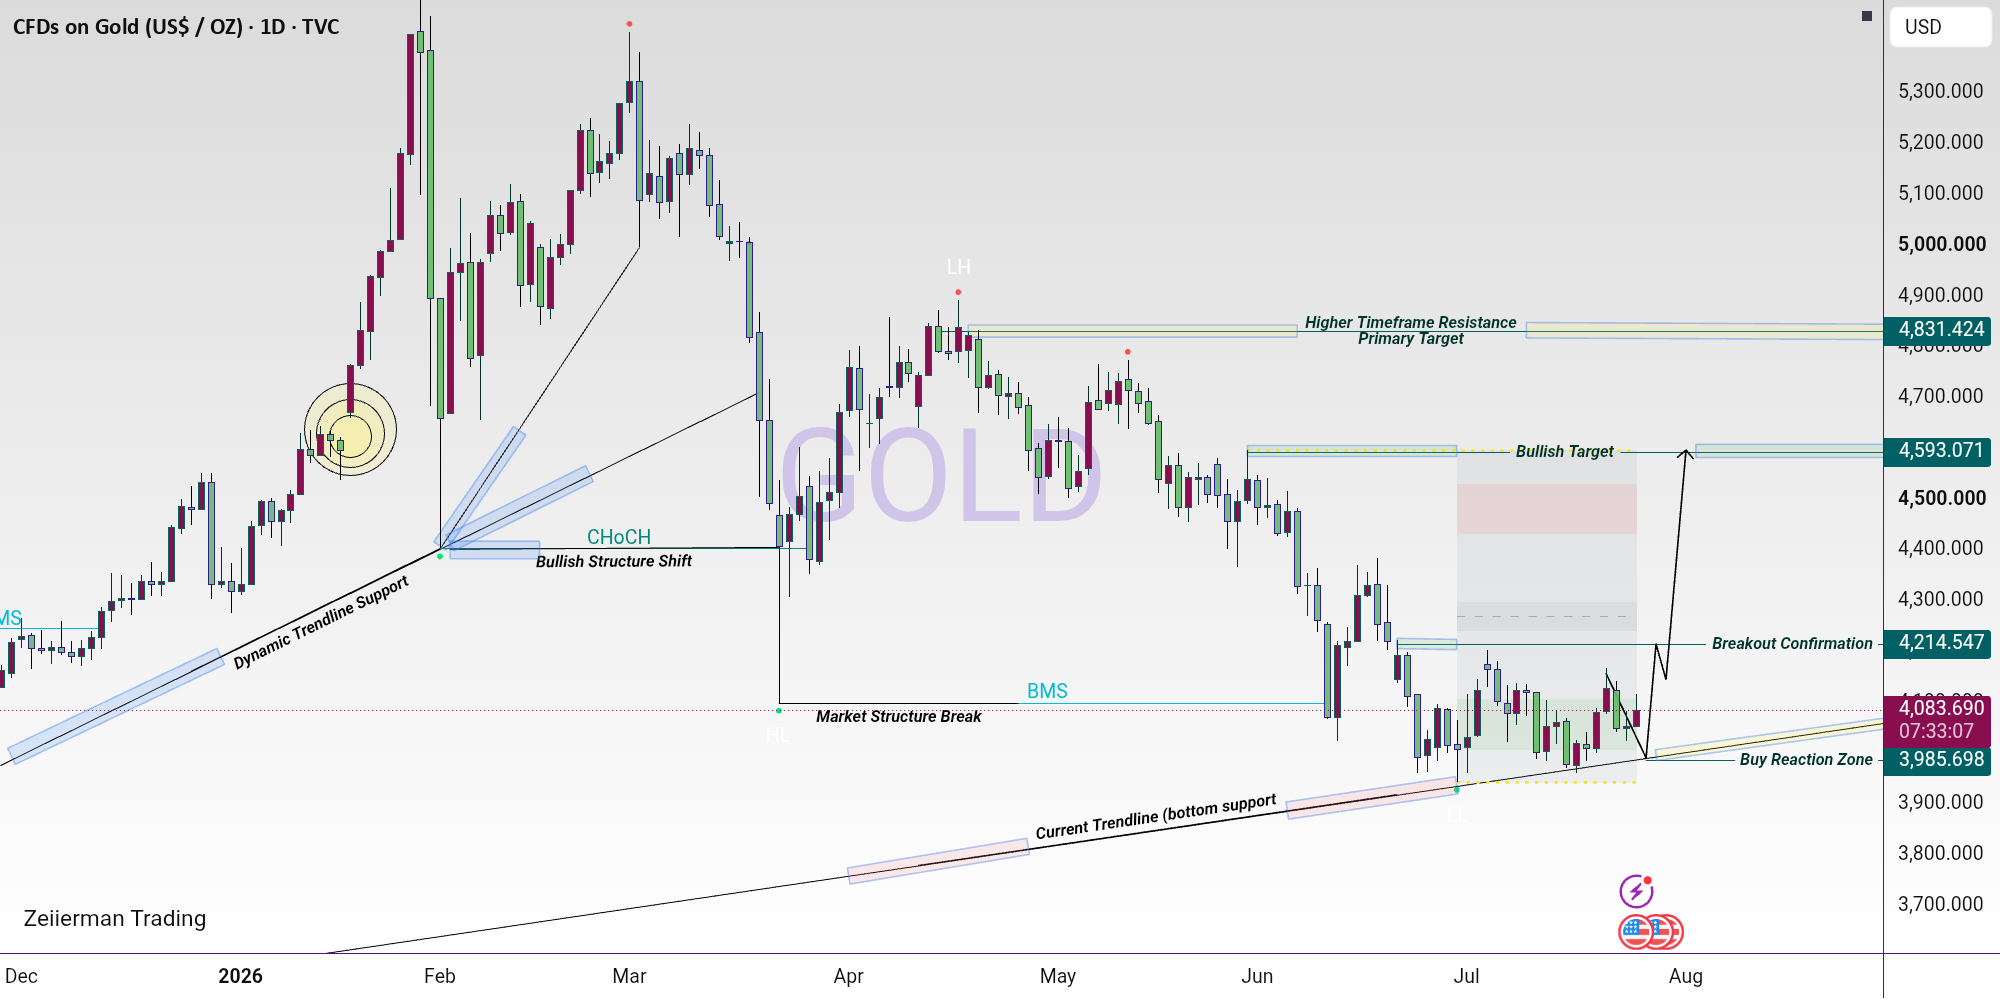
XAUUSD Daily Market Structure Analysis | Educational Description
This chart presents a complete educational view of Gold (XAUUSD) using market structure, trendline analysis, and price action. Every candle contributes to the story of how buyers and sellers interact, showing where momentum changes, liquidity is collected, and high-probability reactions can develop. This analysis is for educational purposes only.
The left side of the chart begins with a strong bullish impulse. Consecutive bullish candles close near their highs, confirming aggressive buying pressure and a healthy uptrend. Small pullback candles are quickly absorbed by buyers, demonstrating that demand remains stronger than supply. As price continues making higher highs and higher lows, the market establishes a bullish structure supported by the rising dynamic trendline.
The first Bullish Market Structure Shift (BMS) confirms that buyers have gained control of the trend. Shortly afterward, CHoCH (Change of Character) appears, indicating a transition in short-term order flow. The following candles continue to respect the trendline, proving that every correction is being bought rather than sold.
As price reaches the upper region of the chart, bullish momentum begins to weaken. Candle bodies become smaller while upper wicks increase, showing profit-taking and institutional selling pressure. The market forms a Lower High (LH), signaling that buyers are losing strength. Bearish candles then begin closing below previous support levels, confirming the start of a corrective decline.
The middle section displays a sequence of bearish candles creating lower highs and lower lows. Every rejection from resistance confirms that sellers remain in control. Temporary bullish candles appear, but they fail to break the dominant bearish structure. This phase teaches that counter-trend rallies often provide liquidity before the primary trend resumes.
The second Bullish Market Structure Shift (BMS) highlights an important educational concept. Although the larger trend remains cautious, buyers begin defending key support and reduce bearish momentum. Candle bodies become smaller near the lows, while bullish candles begin closing above previous highs. This change suggests accumulation rather than continued distribution.
The current price is reacting from the Dynamic Trendline Support, where several candles repeatedly reject lower prices. Long lower wicks indicate that buying interest is increasing around this support area. Instead of breaking lower, price stabilizes and begins producing stronger bullish candles, demonstrating improving market sentiment.
The Buy Reaction Zone represents an area where buyers previously entered the market. If price continues respecting this zone, bullish continuation becomes more likely. The Breakout Confirmation level acts as the first major obstacle. A strong daily candle closing above this level would confirm renewed buying strength and improve the probability of further upside.
The projected bullish path illustrates a common educational scenario: price may briefly retest support before continuing higher. Such pullbacks often remove weak positions and allow institutional participants to accumulate before another impulsive move.
The first projected objective is the Bullish Target, where price may encounter moderate selling pressure. If momentum remains strong, the next destination becomes the Higher Timeframe Resistance / Primary Target, which represents a significant daily resistance level. This is an area where traders commonly monitor for profit-taking or fresh selling activity.
Overall, every candle on this chart demonstrates an important lesson in price action. Strong bullish candles reveal aggressive demand, large bearish candles indicate institutional selling, small-bodied candles represent consolidation, and long wicks highlight liquidity collection. Rather than relying on a single candle, professional traders study the relationship between market structure, trendlines, support and resistance, BOS, CHoCH, and momentum before making decisions. Patience, confirmation, and disciplined risk management remain the foundation of consistent trading.