
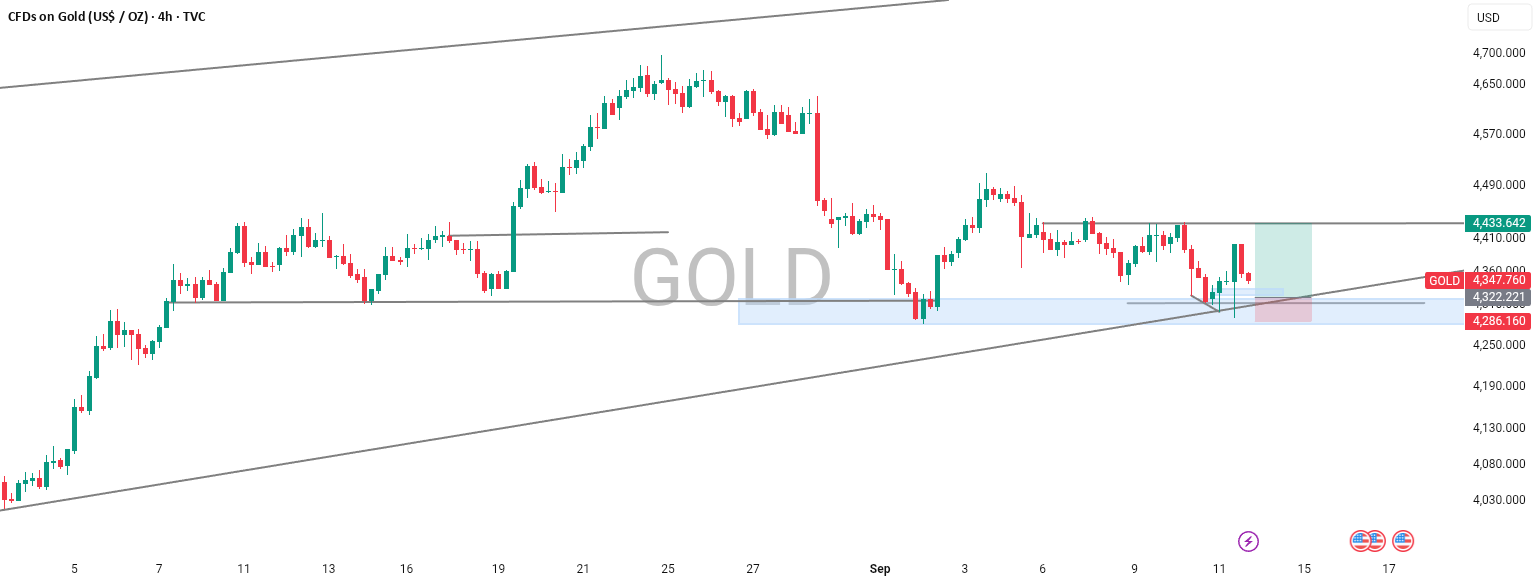
Gold is currently trading around 4,347, with price reacting from a major 4H demand/support zone around 4,286–4,322.
The chart shows an interesting confluence: price is sitting near the ascending trendline, while the recent reaction from the demand zone suggests buyers are still defending this area.
Key Levels
Resistance
4,433 — major horizontal resistance
4,470 — previous reaction area
4,550–4,650 — higher resistance zone if the bullish structure continues
Support
4,322 — immediate support
4,286 — key demand-zone floor
The rising trendline also provides dynamic support
Bullish Scenario
If Gold continues to hold 4,286–4,322 and buyers push price back above 4,433, that would strengthen the bullish case.
A confirmed break and close above 4,433 could expose the 4,470 area first, followed by higher levels around 4,550+.
The important point is not simply touching resistance, but seeing a convincing breakout and continuation.
Bearish Scenario
If price fails to hold the 4,286–4,322 demand zone and breaks decisively below the ascending trendline, the current bullish structure would weaken.
A sustained move below 4,286 could signal that sellers are gaining control and that a deeper correction may develop.
What I’m Watching
4,286–4,322 = key decision zone
4,433 = breakout level
4,470 = next upside objective
Below 4,286 = bullish setup weakened
For now, Gold remains at an important technical decision point. The reaction from the support zone and the next move around 4,433 should provide more confirmation of the market’s direction.
This is technical analysis, not financial advice. Always manage risk and wait for confirmation before making a trading decision.
#Gold #XAUUSD #GoldAnalysis #Forex #TradingView #TechnicalAnalysis #PriceAction #XAUUSDAnalysis