
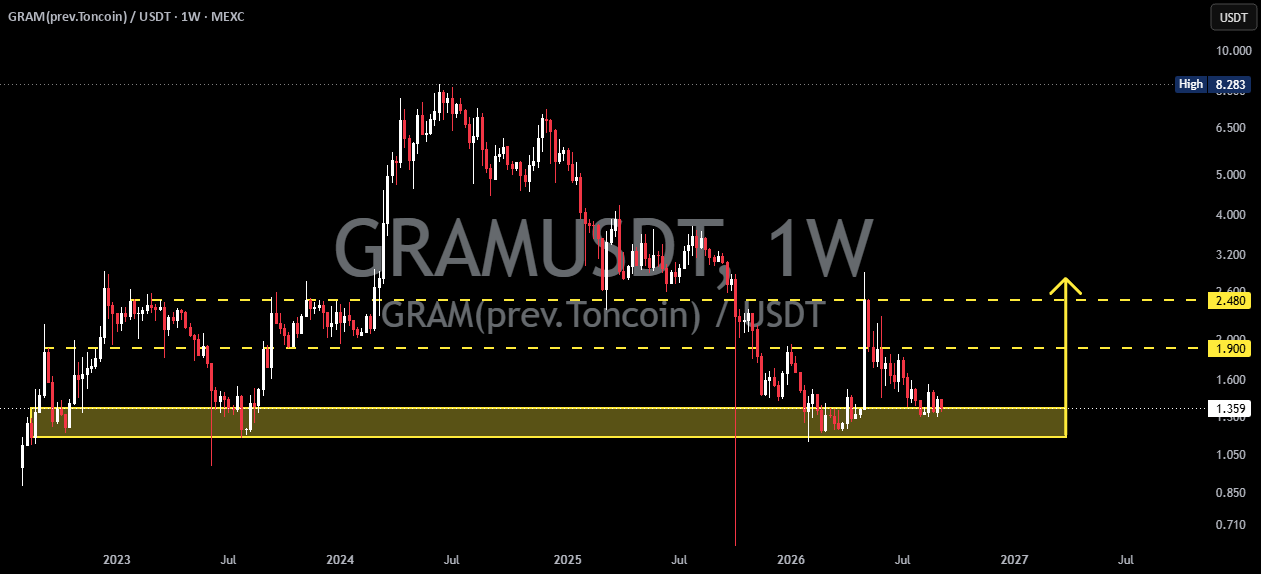
GRAM/USDT — 1W is currently at a very important area. Price has experienced a major decline from the ATH of 8.283 USDT and is now retesting the major demand/support zone at 1.16–1.36 USDT.
This yellow zone has historically acted as an area of price reaction, so the next move from this region could determine GRAM’s direction over the coming weeks to months.
—
📌 Market Structure & Current Condition
🔻 Long-Term Downtrend
Since reaching a high around 8.283 USDT, GRAM has formed a bearish structure characterized by a series of Lower Highs (LH) and Lower Lows (LL).
📉 Bearish pressure remains visible on the larger structure, but price is now approaching a support area that has previously generated bullish reactions.
🟨 Major Demand Zone: 1.16–1.36 USDT
This is the most important zone on the chart at the moment. Price is currently trading around the upper part of this zone, making the buyer reaction here especially important.
🔄 Potential Accumulation / Base Formation
Price action around 1.16–1.36 appears to be forming a base after a prolonged downtrend. If buyers can defend this zone, it could develop into an accumulation phase before a larger reversal.
⚠️ However, until a key resistance breakout occurs, the long-term structure cannot yet be considered fully bullish.
—
🟢 Bullish Scenario — Potential Major Reversal
💚 As long as price manages to hold above 1.16 USDT, the demand zone remains valid.
📈 Initial bullish confirmation would become stronger if GRAM successfully reclaims and breaks above 1.90 USDT with a solid Weekly candle.
🎯 Key Resistance / Targets:
1️⃣ 1.90 USDT — First Major Resistance
2️⃣ 2.48 USDT — Major Resistance & Breakout Level
3️⃣ 3.20 USDT — Next Resistance
4️⃣ 4.00+ USDT — Potential Continuation Area
🚀 If price successfully breaks above 2.48 USDT, it could indicate that the long-term bearish structure is beginning to shift.
🔥 A breakout of 2.48 USDT + a successful retest would provide significantly stronger confirmation for a potential recovery toward higher resistance levels.
—
🔴 Bearish Scenario — Demand Zone Breakdown
⚠️ Bearish risk increases if GRAM loses 1.16 USDT.
📉 A Weekly close below 1.16 USDT would signal that the 1.16–1.36 demand zone has failed to hold price.
🔻 Under this condition, the bearish structure could resume, with price potentially searching for new support at lower levels.
🚨 It is important not to focus only on a wick or false breakdown. For stronger breakdown confirmation, a Weekly candle that actually closes below the zone would be significantly more meaningful.
—
🧩 Pattern Explanation
🟨 Major Demand / Accumulation Zone
The 1.16–1.36 USDT area is a key zone where buyers may potentially step in again.
Price has spent considerable time around this area, indicating consolidation following a prolonged downtrend.
📉 Descending / Bearish Market Structure
The larger structure remains bearish because price has not yet successfully produced a Break of Structure (BOS) above important resistance.
🔄 Potential Bottom Formation
Consolidation near the major demand zone could represent the early stage of a bottom formation.
However, a bottom is not confirmed simply because price is at support.
Confirmation would become stronger through the sequence:
Demand Hold → Higher Low → Break 1.90 → Break 2.48 → Retest → Continuation
—
🎯 KEY LEVELS TO WATCH
🟨 1.16–1.36 USDT → Major Demand Zone
🟡 1.90 USDT → First Bullish Confirmation
🟡 2.48 USDT → Major Breakout Level
🟠 3.20 USDT → Next Resistance
🔴 8.283 USDT → Historical ATH
—
⚖️ Conclusion
📊 GRAM is currently in a technically interesting area as it retests the major 1.16–1.36 USDT demand zone.
🟢 Bullish: As long as demand holds and price manages to reclaim 1.90 USDT, the probability of a recovery toward 2.48 USDT becomes increasingly interesting. A breakout above 2.48 could open the door for a larger continuation move.
🔴 Bearish: If 1.16 USDT is broken and the Weekly candle closes below it, the bullish thesis loses validity and the risk of continued downside increases.
🔥 Key Takeaway:
1.16–1.36 = Battle Zone
1.90 = First Bullish Confirmation
2.48 = Major Breakout Trigger
> ⚠️ DYOR — This is technical analysis, not financial advice.
#GRAM #GRAMUSDT #Toncoin #Crypto