
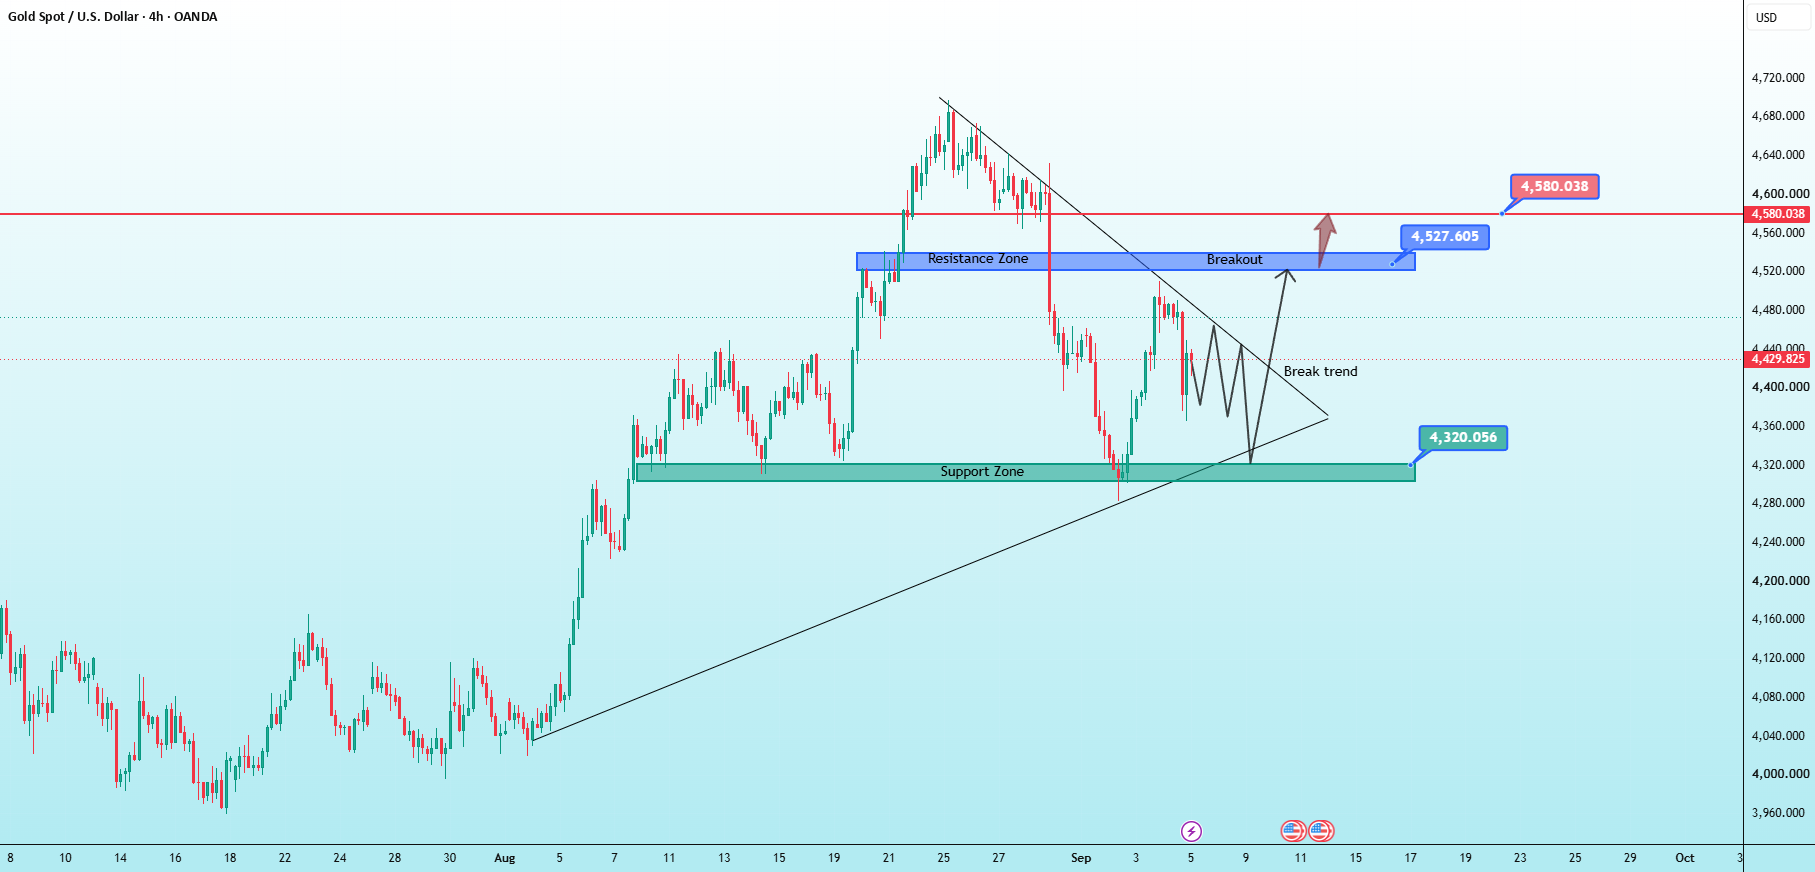
Based on the XAU/USD chart, the current structure shows that price is correcting within a larger uptrend. The most notable point is that price is currently trading between support at 4,320 and resistance at 4,527–4,580, while a descending trendline needs to be broken to confirm a return of bullish momentum.
🔴 Resistance
1. 4,520 – 4,535 — Key Resistance
This is the Resistance Zone on the chart.
Reference level: 4,527.605.
This is also the breakout area that price needs to overcome to confirm a breakout from the current corrective structure.
If price tests this zone but gets rejected → the possibility of continued sideways movement/correction remains.
2. 4,570 – 4,585 — Strong Resistance
Key level around 4,580.038.
This is the next target after a breakout above 4,527.
If price breaks above this entire zone, the bullish structure will become very positive.
🟢 Support
1. 4,315 – 4,330 — Main Support
This is an important Support Zone, with the key level at 4,320.056.
Price has reacted several times around this area.
More importantly, the long-term ascending trendline is also converging around this support zone.
If the 4,315–4,330 zone continues to hold → this remains the preferred area to look for BUY signals.
📉 Descending Trendline
The trendline from the most recent high is currently putting pressure on price.
The structure can currently be viewed as:
Bottom → strong rally → formation of a high → correction → consolidation below the descending trendline.
Therefore, a trendline breakout + break above 4,527 will be more significant than simply a spike above the resistance zone.
📈 Bullish Scenario
The ideal scenario:
4,320 → consolidation → break the descending trendline → break 4,527 → 4,580
After breaking above 4,527, it would be better to wait for price to retest 4,520–4,535 and hold this zone. This would provide a more reliable confirmation of continued bullish momentum.
Targets:
TP1: 4,527
TP2: 4,580
Break above 4,580 → further upside targets can be extended.
📉 Bearish Scenario
If price continues to be rejected below the trendline and fails to break 4,520–4,535, it could move back toward:
4,450 → 4,400 → 4,320
In particular, if 4,320 is strongly broken, the current bullish scenario will weaken significantly, and the larger market structure will need to be reassessed.