
NAS100 🌍
The macro narrative heading into this week is dominated by sensitive interest rate expectations and the classic September volatility seasonal window 🏦. Interestingly, general online sentiment is heavily leaning bearish, with market chatter suggesting that higher bond yields and persistent Fed hawkishness will trigger a deep seasonal sell-off. However, this retail consensus is currently over-extended on the short side, creating a prime environment for a classic liquidity hunt before any real directional move gets under way.
We are seeing a clear bullish market structure progression on the H4 timeframe as price continues to print higher lows after sweeping the lower range 📈. While retail traders across online communities keep trying to call a market top and fade this recovery, Dow Theory dictates that as long as our structural higher lows remain intact, the path of least resistance remains upward. This positioning mismatch tells me retail sellers are likely getting trapped at resistance levels, setting up a Wyckoff-style markup Phase C/D continuation once liquidity above the value area is secured.
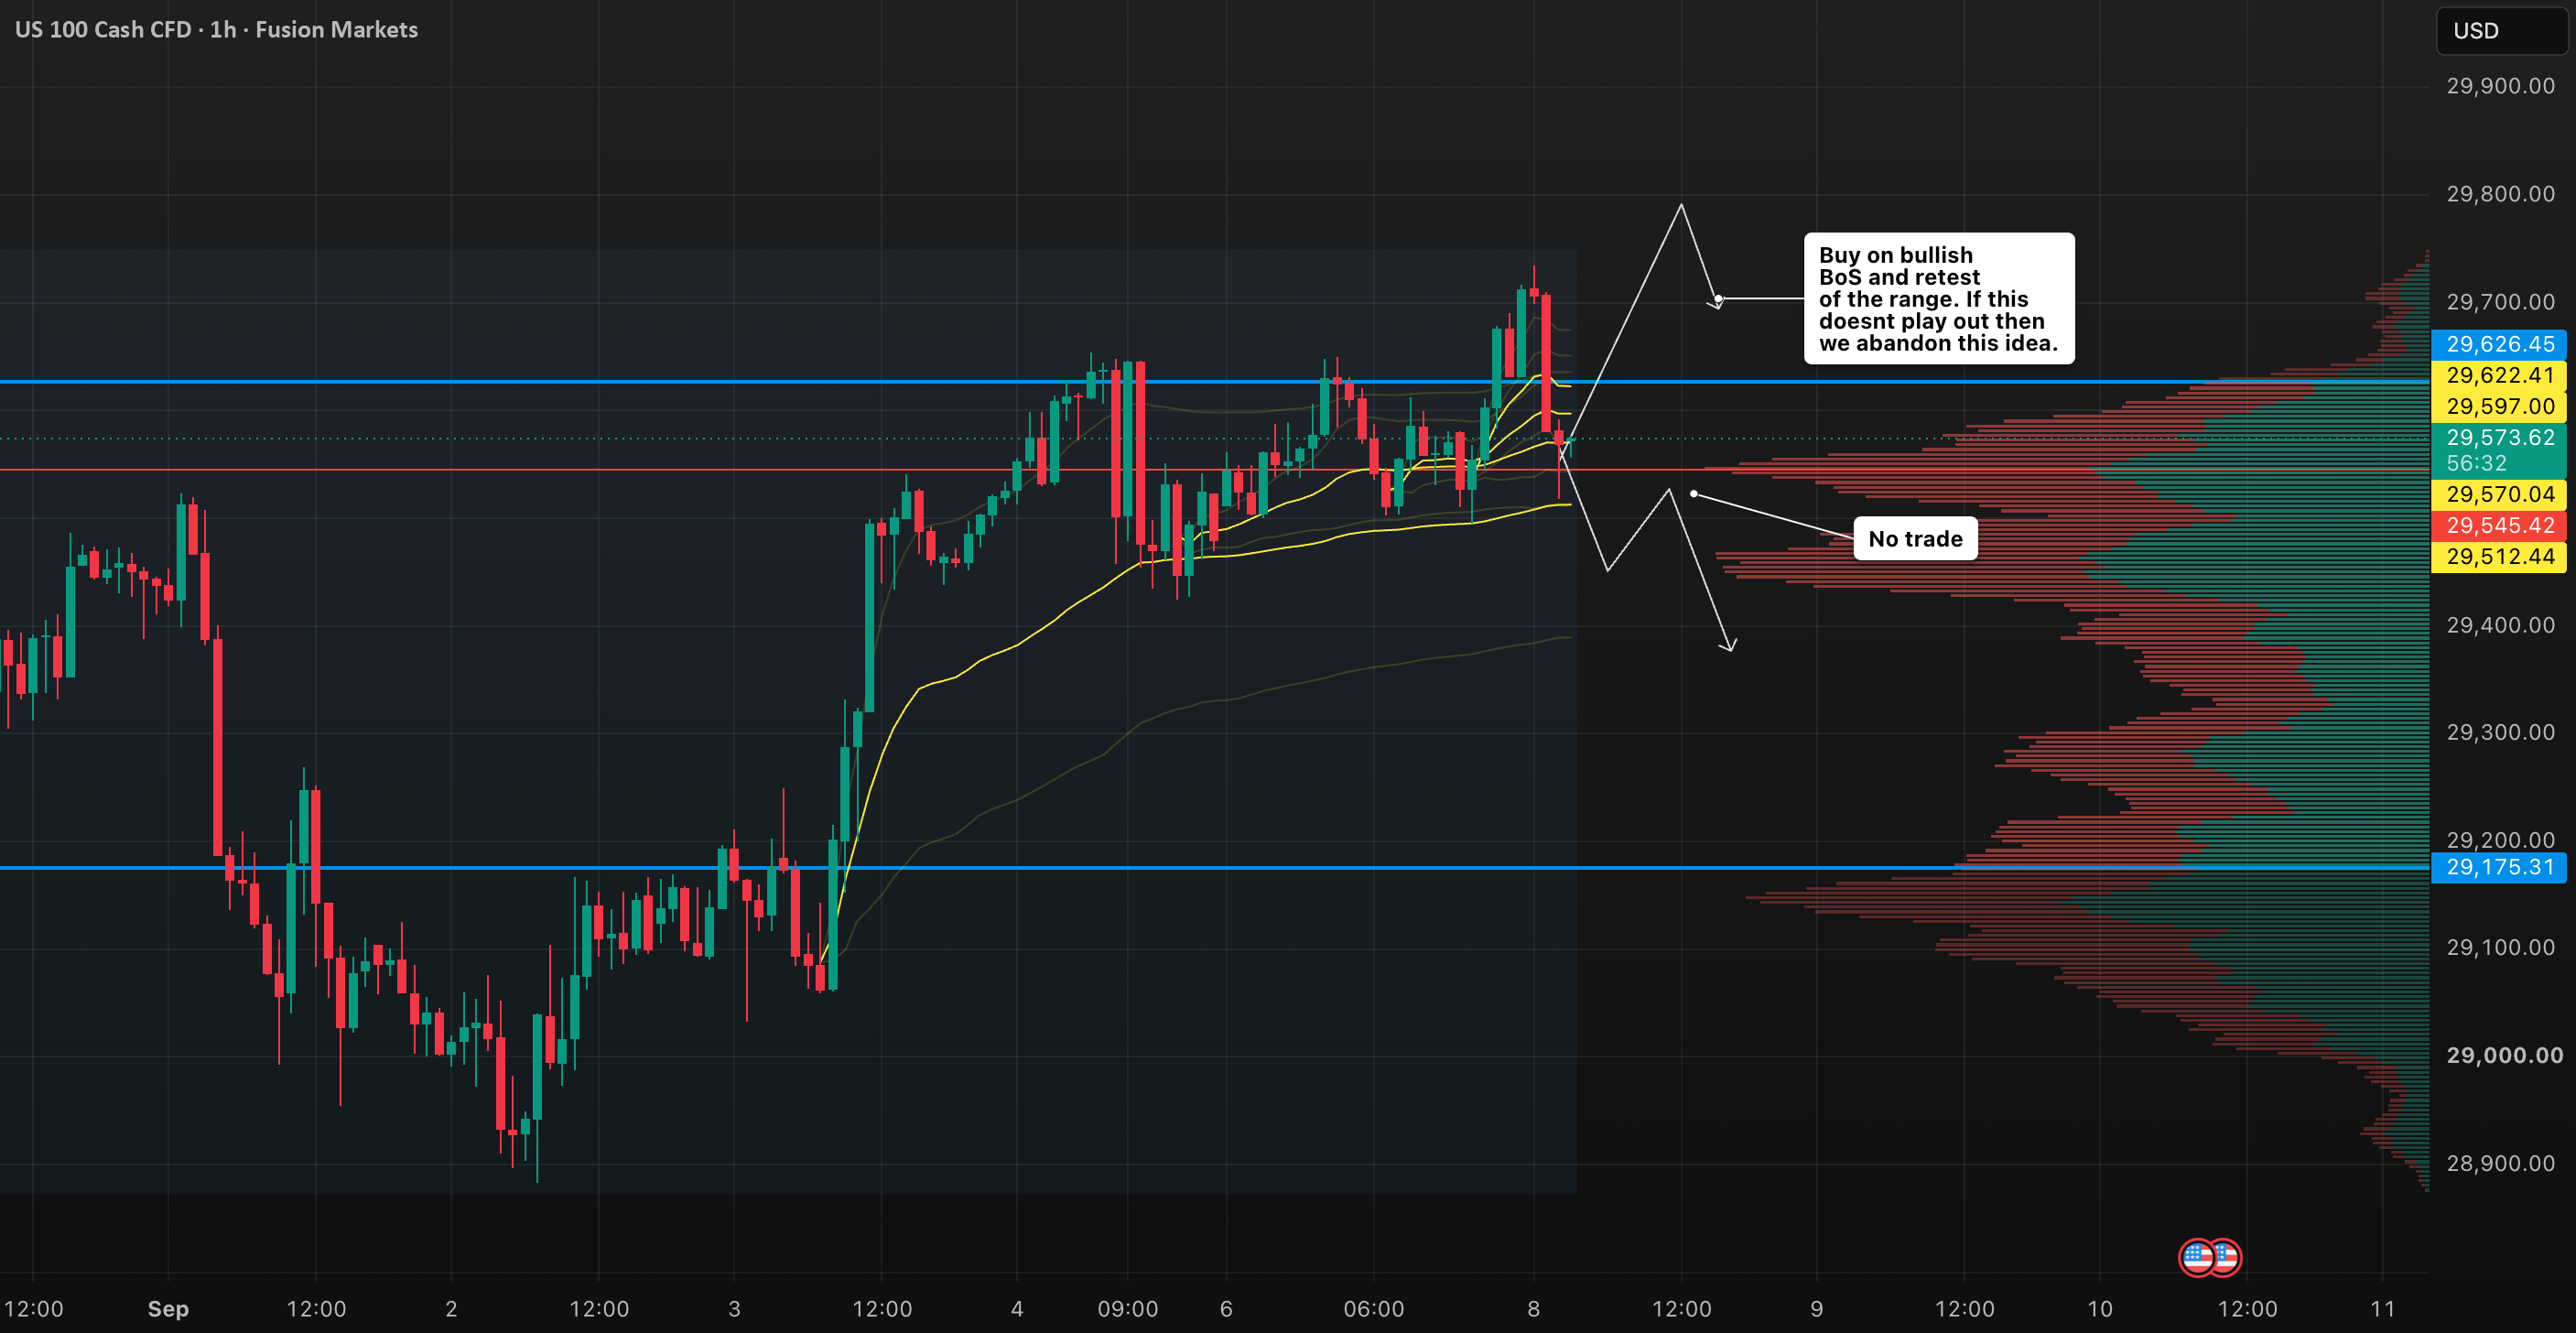
Key Zone: Looking directly at the visible Volume Profile data on the H4 chart, price is actively coiling right at the upper boundary of the established balance trunk 📉. The Volume Profile Value Area High (VAH) sits tightly around the 29,616–29,626 band, acting as the immediate line in the sand separating horizontal acceptance from imbalance discovery.
Zooming out to the broader weekly context, price has successfully engineered a low-volume liquidity sweep down around the 28,900–29,175 structural shelf. I am watching for a swift “run on liquidity” to sweep the late shorts who are piling into resistance across various social forums 🧹. If buyers can force a firm acceptance and break above this Volume Profile Value Area High near 29,626, we should see an immediate expansion leg towards psychological resistance at 30,000. However, if we see a failure to hold and a quick rejection back down into value (under ~29,567), I will gladly step back and let the trade go—there is no edge in fighting an active reclaim of value into a sideways chop box.
My Trade Plan 🎯
Bias: Long (Conditional). Patience is required to wait for actual market acceptance above the value area rather than front-running the breakout.
Entry Protocol: Look for a clean H4 Break of Structure (BoS) and candle close above the Volume Profile Value Area High (29,616 – 29,626), followed by a lower-timeframe retest of that VAH level as support. If price breaks under and reclaims back into the internal value node towards 29,500, abandon the long setup entirely and step aside (“No Trade”).