
The biggest news in the finance world for the last month has been SpaceX.
$2 trillion valuation. Largest IPO in history. You’ve heard it all by now.
Here’s what I want you to focus on instead.
SPCX isn’t a TPS trade, not yet. There’s no trend, pattern, or squeeze because it’s too soon. The stock started trading Friday afternoon. There’s nothing on the chart to read.
But in Rocket Lab (RKLB), Friday handed us a year’s worth of signals in one session.
Trending Higher
RKLB has been one of the strongest trends I’ve traded in years. Up roughly 320% over the past 12 months.
From a 52-week low near $25 to an all-time high of $151 on May 27.
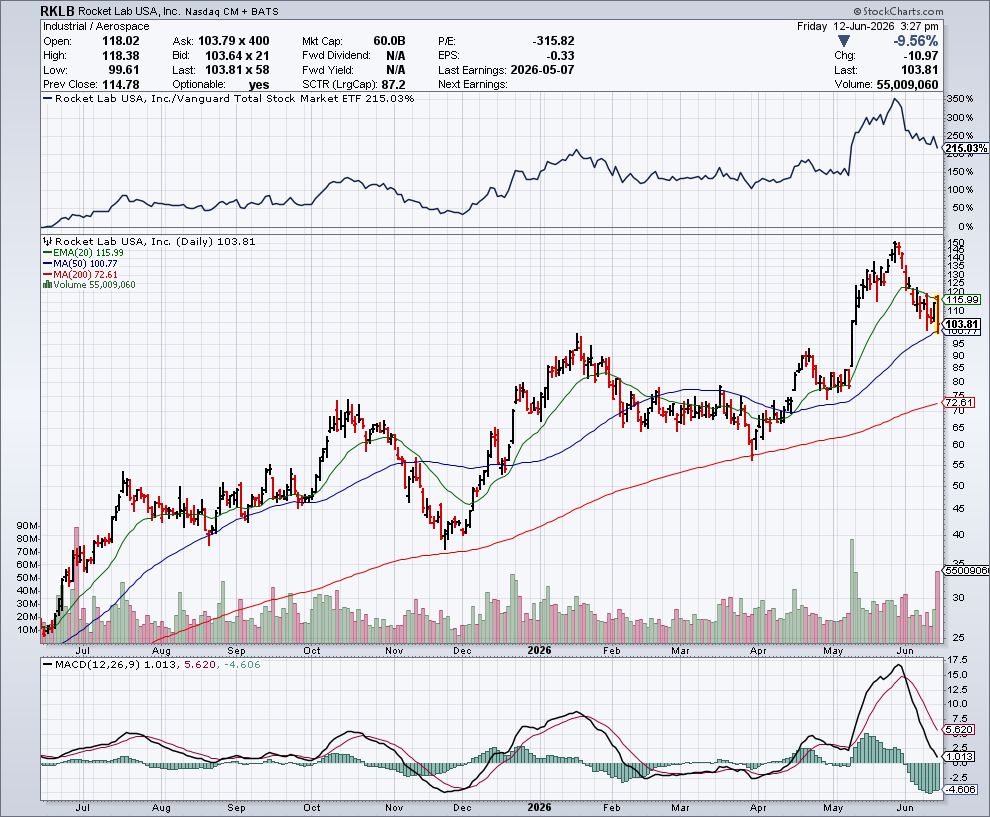
Thursday night, Nasdaq announced RKLB was joining the Nasdaq-100. Guaranteed buying from every index fund that tracks it. About as good as news gets for a stock.
Friday morning, SpaceX went public. The exact catalyst this whole sector has been riding for two months.
Two of the best things that could happen to this stock, back to back.
RKLB gapped up at the open near $118… and then got sold all day.
By the close, it was down more than 7% from Thursday, sitting around $106. That’s not a “sell the news” reaction. That’s “sell GREAT news.”
That’s a trend cracking.
Parabolic Pattern
The pattern is right there if you know how to look: a parabolic run into an all-time high, a pullback, one more euphoric pop on genuinely good news… and then a hard reversal on the day the whole market’s been anticipating for months.
I always say, if you have to squint to see the pattern, it’s not real. I didn’t squint here. Gap up, full reversal, close near the lows of the day. That’s a textbook exhaustion candle.
Squeeze Over, Nasdaq
A trend that runs 320% in a year with barely a pullback doesn’t leave room for downside volatility. That’s compression.
Friday’s reversal, on the single biggest catalyst day this sector has had all year, is that compression releasing.
The question for today: is this the start of something, or a one-day flush that gets bought?
RKLB officially joins the Nasdaq-100 before the open on June 22.
The fundamentals are strong: record $2.2 billion backlog, 64% revenue growth, a role in the Golden Dome missile defense program.
So there’s a real case for “the dip gets bought before the index flows arrive.”
While this stock was running to $150, the people who run the company were selling into it.
Rocket Lab director Alexander Slusky sold 100,000 shares in mid-May around $115-120… then came back three weeks later and sold another 40,000 shares on June 2 at $123.60. Nearly $5 million, twice, both times near short-term highs.
COO Frank Klein sold almost 37,000 shares on May 28 at prices up to $150, right at the all-time high, under a 10b5-1 plan set last September.
Pre-scheduled plans don’t mean panic. But when insiders are selling into strength at multiple points on the way up, and then the stock prints its first real reversal candle on the biggest news day of the year… that’s confluence.
TPS and the Form 4s are telling a similar story.
Your Action Plan
Friday gave us the data point this chart has been missing for twelve months, the first real crack.
$106 is my line for Monday. Hold it into the Nasdaq-100 inclusion date and this is probably healthy digestion. Lose it with conviction, and a year of one-way momentum just told you something important.
I’ll be watching the open, you should join me.