
Airbnb spent fifteen years trying to put hotels out of business.
Now it’s selling hotel rooms.
That’s not a headline anybody ran with, but it’s the most important thing happening at this company. Airbnb (ABNB) has been quietly rebuilding a dedicated hotel operation, hiring hotel executives to run it, and piloting with boutique and independent properties in cities like New York and Madrid.
Hotel nights are still a single-digit slice of total bookings. But they’re growing at nearly double the rate of the platform overall, and management has said out loud that they want to exit 2026 with hotels being a meaningfully larger part of the business.
Think about what that means.
The company whose entire origin story was “why pay for a hotel when you can stay in someone’s spare room” just decided the hotel room is worth selling too.
That’s not a pivot away from the model. That’s Airbnb deciding it isn’t a home-rental company anymore. It’s a travel platform, and it wants every night you book, whatever roof is over it.
The rest of the business backs that up.
Nights booked on the app grew 22% year-over-year and now make up 63% of all nights, up from 58%. First-time bookers accelerated to 10% growth, the fastest since early 2022, with Brazil, Japan, and India leading.
Expansion markets are growing at roughly twice the rate of the core markets.
And after Q1, the company raised its full-year 2026 revenue outlook and guided adjusted EBITDA margin to at least 35%.
Then came the World Cup, and it worked exactly like a platform is supposed to work.
Over 100,000 homes listed in host cities for the first time. Around one in six guests booking a tournament stay was a brand-new Airbnb user. The company called it the biggest hosting event in its history, bigger than the Paris Olympics.
The nightly rates came in mixed, and plenty of people wrote the whole thing off because of it. I think they measured the wrong thing. Rates are temporary. A hundred thousand new hosts and a wave of first-time users are supply and demand that stick around long after the last match.
Meanwhile the market is still valuing this thing at a 35.92 P/E like it’s a house-rental site.
And the chart’s doing exactly what I look for in a momentum setup.
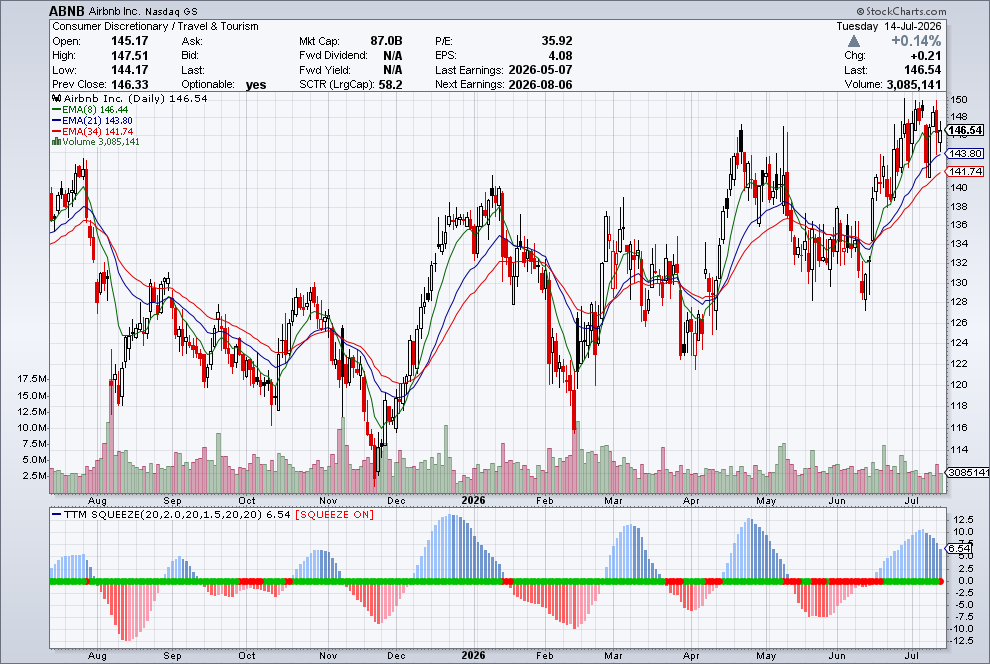
ABNB is in a bullish stacked-EMA setup on both the daily and weekly timeframes. On the daily, the 8 EMA sits at 146.44, the 21 at 143.80, and the 34 at 141.74, stacked in order with all three sloping up.
Price closed at 146.54, right on top of the 8. That’s the trend and the pattern.
Underneath it, a daily squeeze is on, with momentum already building to the upside.
That’s the cleanest version of my TPS framework: trend, pattern, squeeze.
All three lined up, on a name with a real story underneath it, three weeks ahead of an August 6 earnings report.
I find that squeezes tend to fire hardest when the fundamentals are pointed the same direction as the chart.
Your Action Plan
One more thing. I’m going live in a few hours at 2pm ET with an urgent trading briefing, and if you’re tracking any of these sector rotations, you absolutely need to be on it.
We’re in the middle of an epic sector rotation right now. Trillions of dollars are moving OUT of what worked last year and INTO completely different parts of the market. Some of the names you own could get crushed while forgotten sectors take off, and it’s all happening this month.
I’ve been tracking these rotations with a strategy I call Sector Strikes. So far this year, I’m at an 85.7% win rate using this exact approach, with an average return of 53% per trade. That’s 5X the typical annual return of the S&P 500, and it takes about 30 minutes a month to execute.
During today’s briefing, I’m walking through the entire 3-step process I use to identify which sectors to exit and which ones to target. I’ll show you the AI-powered tool we use to track the rotations in real time.
And I’ll reveal the exact sectors and stocks I’m watching for my next Sector Strike on July 20th. All attendees get that intel for free.
This is happening TODAY at 2pm ET. Don’t sleep on it.