
August 2004. I’ll never forget it.
Walking around Midtown Manhattan on a hot summer day, sweating in a suit, Blackberry in hand as I feverishly made calls to clients.
I was trying to explain to them how they could buy into the most anticipated IPO on Wall Street (at the time).
The company was Google (GOOG).
And shares gained over 200% during its first public year before settling into a lengthy consolidation period.
But while the excitement of Google’s IPO is similar to that of SpaceX, there are a few important differences that you need to know.
SpaceX Isn’t Google
First, (and I can’t stress this enough), Google was profitable when it went public.
The company reported net income of $106 million on $962 million in revenue during 2003. By the time it reached the public markets, annualized profits had climbed to approximately $286 million.
SpaceX falls well short of that.
Second, Google entered the market with a powerful tailwind at its back.
The Nasdaq was emerging from a brutal multi-year bear market following the collapse of the dot-com bubble.
Valuations had been reset, investor expectations were far more reasonable, and the S&P 500 traded at roughly 16 times earnings, nearly half of todays at 31 times.
Put simply, Google launched into a market recovering from excess.
SpaceX is launching into a market defined by it.
One More BIG Difference
The market is run by math and science.
In this case, the market’s math is sending us a very clear message: “Don’t buy the SpaceX IPO early!”
Over the past 24 hours, I compiled a study of two dozen of the largest and most anticipated IPOs, direct listings, and public market debuts of the modern era.
Companies like META, UBER, Rivian (RIVN), Coinbase (COIN), Snowflake (SNOW), Airbnb (ABNB), Robinhood (HOOD), and others that dominated headlines when they went public.
I’ve also included lesser hyped IPOs like Visa (V), Kinder Morgan (KMI) and UPS.
The goal: determine whether investors have benefitted from buying IPOs on the first day of trading.
The results were remarkably consistent.
Buy IPOs 225 Days After Their Debut
Yes, that 225 is a real number, here’s how I got there.
The average IPO in the study declined 43% from its opening before reaching its first-year low.
Some even saw declines greater than 50%…
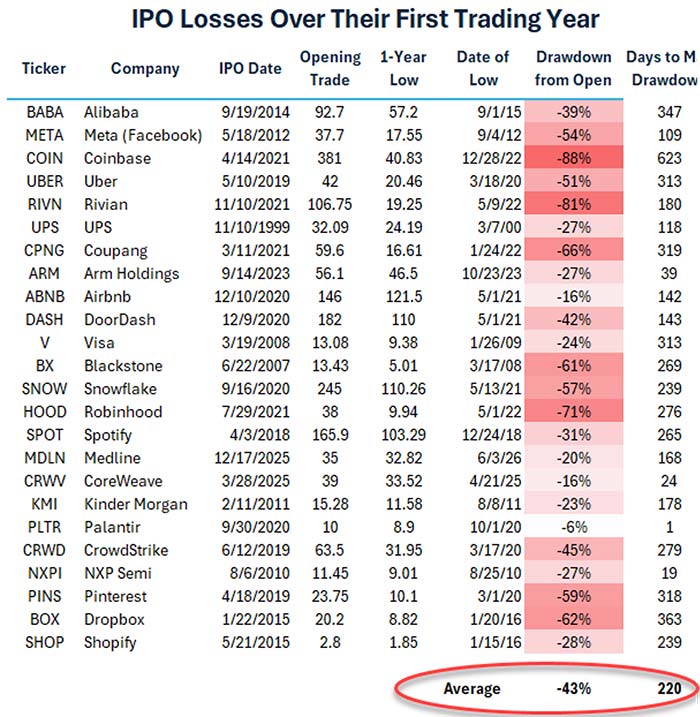
These are not failed companies. Many have become tremendous long-term investments.
Yet investors who rushed to buy the opening excitement often endured months of frustration and substantially lower prices before those long-term gains materialized.
This is history telling us that a great company and a great entry point are often two very different things.
Play the Long Game
At first glance, that sounds like a reason to avoid the SpaceX IPO. It isn’t.
This study has another layer.
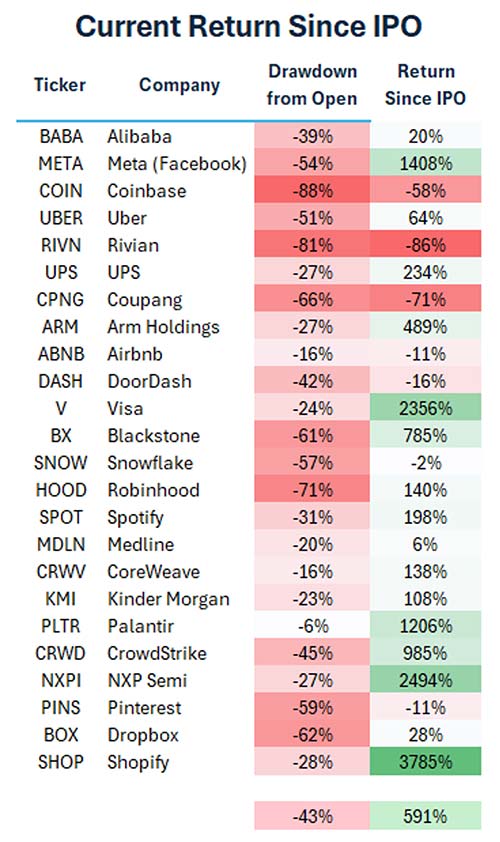
The same group that saw average losses of -43% in the first year achieved average gains of 591%.
|
Meta gained more than 1,400% from its IPO. Palantir (PLTR) is up more than 1,200%. CrowdStrike (CRWD) has gained nearly 1,000%. Shopify (SHOP) has returned almost 3,800%.
The lesson isn’t to avoid great companies. It’s to avoid treating an IPO like a one-day event.
On average, the companies in this study required approximately 225 days to reach their first-year lows. Investors who bought during that period achieved dramatically lower cost bases than those who went all-in on Day One.
Here’s How I Plan to Buy SpaceX
A measured approach.
Instead of attempting to elbow my way into a “priced for perfection” IPO, I plan to use the time-tested dollar-cost averaging strategy.
Establish an initial position in SpaceX one month after the IPO, and then continue purchasing shares at regular time intervals throughout the first year of trading.
This approach can significantly reduce my average cost basis while limiting the risk of overpaying for emotion.
As an example, let’s look at what would have happened if you used this simple strategy with META.
META’s IPO hit the market in May 2012. Shares suffered a -54% drop over the following 109 days.
Now, the stock reflects a return of 1,407% from its IPO. A $12,000 investment in the IPO would be worth $180,490.44 today.
Solid, right?
But compare that to a dollar cost averaging strategy of investing $1,000 a month on the first day of the month for a year.
With this method, your average price per share is $25.15, compared to the IPO price of $37.04.
That slow and steady dollar cost average approach yields a current value of $273,122.80, 51% higher than the straight purchase of the IPO.
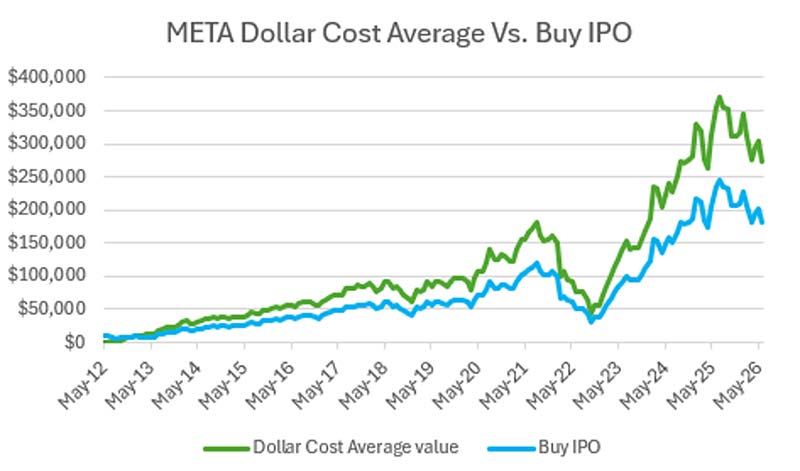
If SpaceX follows this historical pattern, a lower average entry price wins.
As a psychological bonus, I’m removing the emotion and stress of trying to time my purchases. Just buy on the first trading day of each month over the next year and let it rip.
Will SpaceX become one of the most important companies of the next decade? Probably.
But once again, the market’s math is sending us a clear signal.
The average IPO in our study lost 44% from its opening trade before reaching its first-year low. Investors who exercised patience were frequently rewarded with better entry points than those who chased the opening excitement.
Excitement creates headlines.
Patience creates opportunity.
 |
FUN FACT FRIDAY
Elon Musk’s very own Tesla Roadster is currently orbiting the Sun. SpaceX launched it as a test payload on the first Falcon Heavy flight in 2018, with a mannequin in a spacesuit (“Starman”) in the driver’s seat and David Bowie’s “Space Oddity” playing on loop, though Bowie’s dulcet tones cannot be heard in the vacuum of space. It’s traveled past Mars’ orbit multiple times and is still out there. You can even track it right here.