Skip to content
Vorkast
  • Home
  • Blog
  • ChartExpand
    • Trading Chart
    • Quick Reference Chart
  • AnalysisExpand
    • Crypto
    • Forex Analysis
    • Precious Metal Analysis
    • Stock Analysis
0
Vorkast
Home / Analysis / Forex Analysis / USD is moving lower helped by lower oil and yields. What are the charts telling traders?

USD is moving lower helped by lower oil and yields. What are the charts telling traders?

USD is moving lower helped by lower oil and yields. What are the charts telling traders?

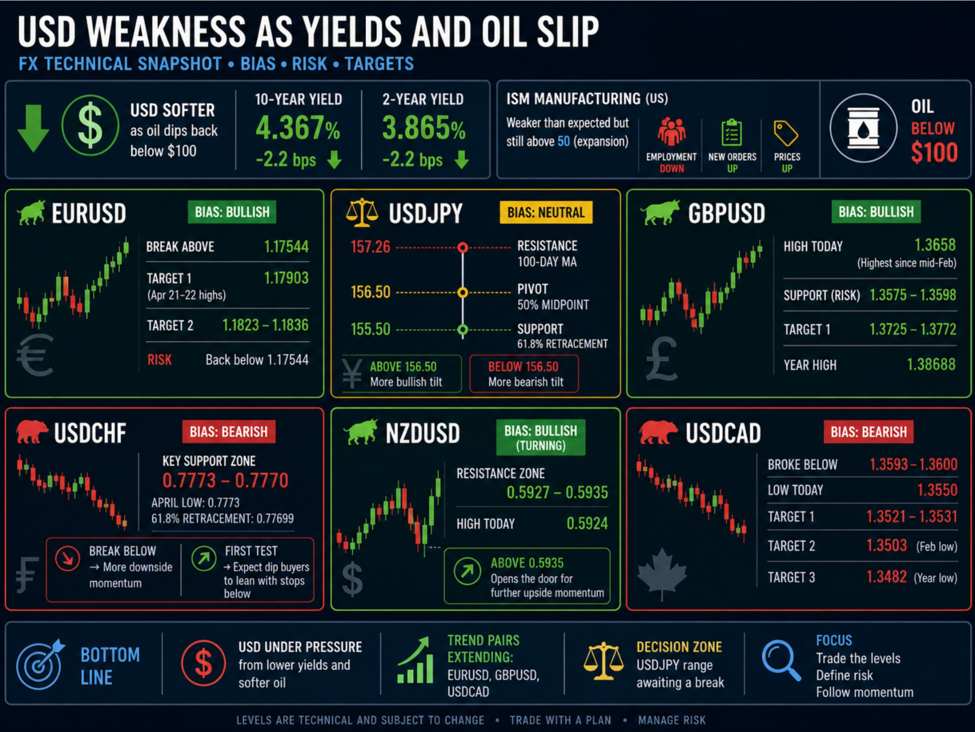
The USD is trading lower today as oil slips back below $100 and Treasury yields edge down. The 10-year yield is off -2.2 bps at 4.367%, while the 2-year is also down -2.2 bps at 3.865%.

On the data front, ISM Manufacturing PMI came in weaker than expected but held above the 50 level—keeping the sector in expansion. The report had a mixed tone: employment declined, while new orders and prices moved higher, pointing to ongoing demand alongside persistent cost pressures.

In the video above, I walk through the major currency pairs versus the USD—breaking down the technicals that define the bias, risk, and targets.

EURUSD

The EURUSD pushed to new highs and is now targeting the April 21–22 highs near 1.1790.

  • Above 1.1790 → opens the door toward the next swing area at 1.1823–1.1836
  • The pair has already broken and extended away from this week’s high at 1.17544, signaling strong upside momentum
  • Bias: Bullish above 1.1754

USDJPY

USDJPY remains range-bound, with key levels clearly defining the battlefield:

  • Resistance: 100-day MA at 157.26
  • Support: 61.8% retracement at 155.50
  • Pivot: 50% midpoint at 156.50

Price is rotating above and below that midpoint—acting as the rudder:

  • Above 156.50 → more bullish tilt
  • Below 156.50 → sellers gain control
  • Bias: Neutral within the range, awaiting a break

GBPUSD

GBPUSD has broken higher after holding support in a key April swing area:

  • Support: 1.3575–1.3598 (now risk-defining zone)
  • High today: 1.3658 (highest since mid-February)

Upside targets:

  • 1.3725–1.3772 (next major swing area)
  • Year high: 1.3869
  • Bias: Bullish above 1.3575

USDCHF

USDCHF continues to push lower and is approaching key support:

  • April low: 0.7773
  • 61.8% retracement: 0.7770

This is a critical decision zone:

  • A break below would increase bearish momentum
  • On the first test, expect dip buyers to lean with tight risk
  • Bias: Bearish, but support is being tested

NZDUSD

NZDUSD has rebounded sharply after making lower lows over the past three weeks:

  • The earlier break below the 4H 200-bar MA (0.5829) failed to sustain momentum
  • Price is now testing a key swing area

Key levels:

  • Resistance: 0.5927–0.5935
  • High today: 0.5924
  • Above 0.5935 → opens the door for further upside extension
  • Bias: Turning more bullish on a break higher

USDCAD

USDCAD continues its move lower, extending the downside momentum from midweek:

  • Broke below swing area at 1.3593–1.3600
  • Low today: 1.3550

Next downside targets:

  • 1.3521–1.3531 (swing area)
  • February low: 1.3503
  • Year low: 1.3482
  • Bias: Bearish below 1.3600

Bottom line:

Lower yields and softer oil are weighing on the USD, while technically, most pairs are either extending trends (EURUSD, GBPUSD, USDCAD) or coiling for a break (USDJPY). The levels above define the battlefield—stay with the bias, define the risk, and let the market confirm the next move

Recent Posts

  • 360 Energy Pulse: What mattered this month in energy
    360 Energy Pulse: What mattered this month in energy
  • Why rising interest rates haven’t crushed stock valuations
    Why rising interest rates haven’t crushed stock valuations
  • May rewired global energy markets
    May rewired global energy markets
  • Stablecoin demand may soon fade, BoE’s Greene says
    Stablecoin demand may soon fade, BoE’s Greene says
  • Market concentration is creating ‘fragility’: Only 60% of S&P 500 stocks are above their 200-day average
    Market concentration is creating ‘fragility’: Only 60% of S&P 500 stocks are above their 200-day average

Recent Comments

No comments to show.

Category

  • Analysis
  • Commodity & Future News
  • Commodity Analysis
  • Crypto Analysis
  • Cryptocurrency News
  • Forex Analysis
  • Forex News
  • News
  • Stocks Analysis
  • Stocks News

Tags

Disclaimer

Financial market trading has large potential rewards, but also large potential risks. You must be aware of the risks and be willing to accept them to invest in the financial markets. Nothing on our website shall be deemed a solicitation to buy or sell; it is up to the trader to take that information and determine his or her trading strategy.

Account

  • Edit Account
  • My Account
  • My Cart
  • My Orders
  • Wishlist

Policies

  • Privacy Policy
  • Return Policy
  • Terms of Use
  • Cookies
  • Disclaimer

© 2026 Vorkast. All Rights are Reserverd

We care about your privacy

In order to provide you a personalized shopping experience, our site uses cookies. By continuing to use this site, you are agreeing to ourĀ cookie policy.

Ask a question

Share


Lost your password?


Don't have an account yet? Sign up

Shopping Cart

Your cart is empty

No items in your cart. Go on, fill it up with something you love!

Start Shopping Now
Select the fields to be shown. Others will be hidden. Drag and drop to rearrange the order.
  • Image
  • SKU
  • Rating
  • Price
  • Stock
  • Availability
  • Add to cart
  • Description
  • Content
  • Weight
  • Dimensions
  • Additional information
Click outside to hide the comparison bar
Compare
Scroll to top
  • Home
  • Blog
  • Chart
    • Trading Chart
    • Quick Reference Chart
  • Analysis
    • Crypto
    • Forex Analysis
    • Precious Metal Analysis
    • Stock Analysis
Search