
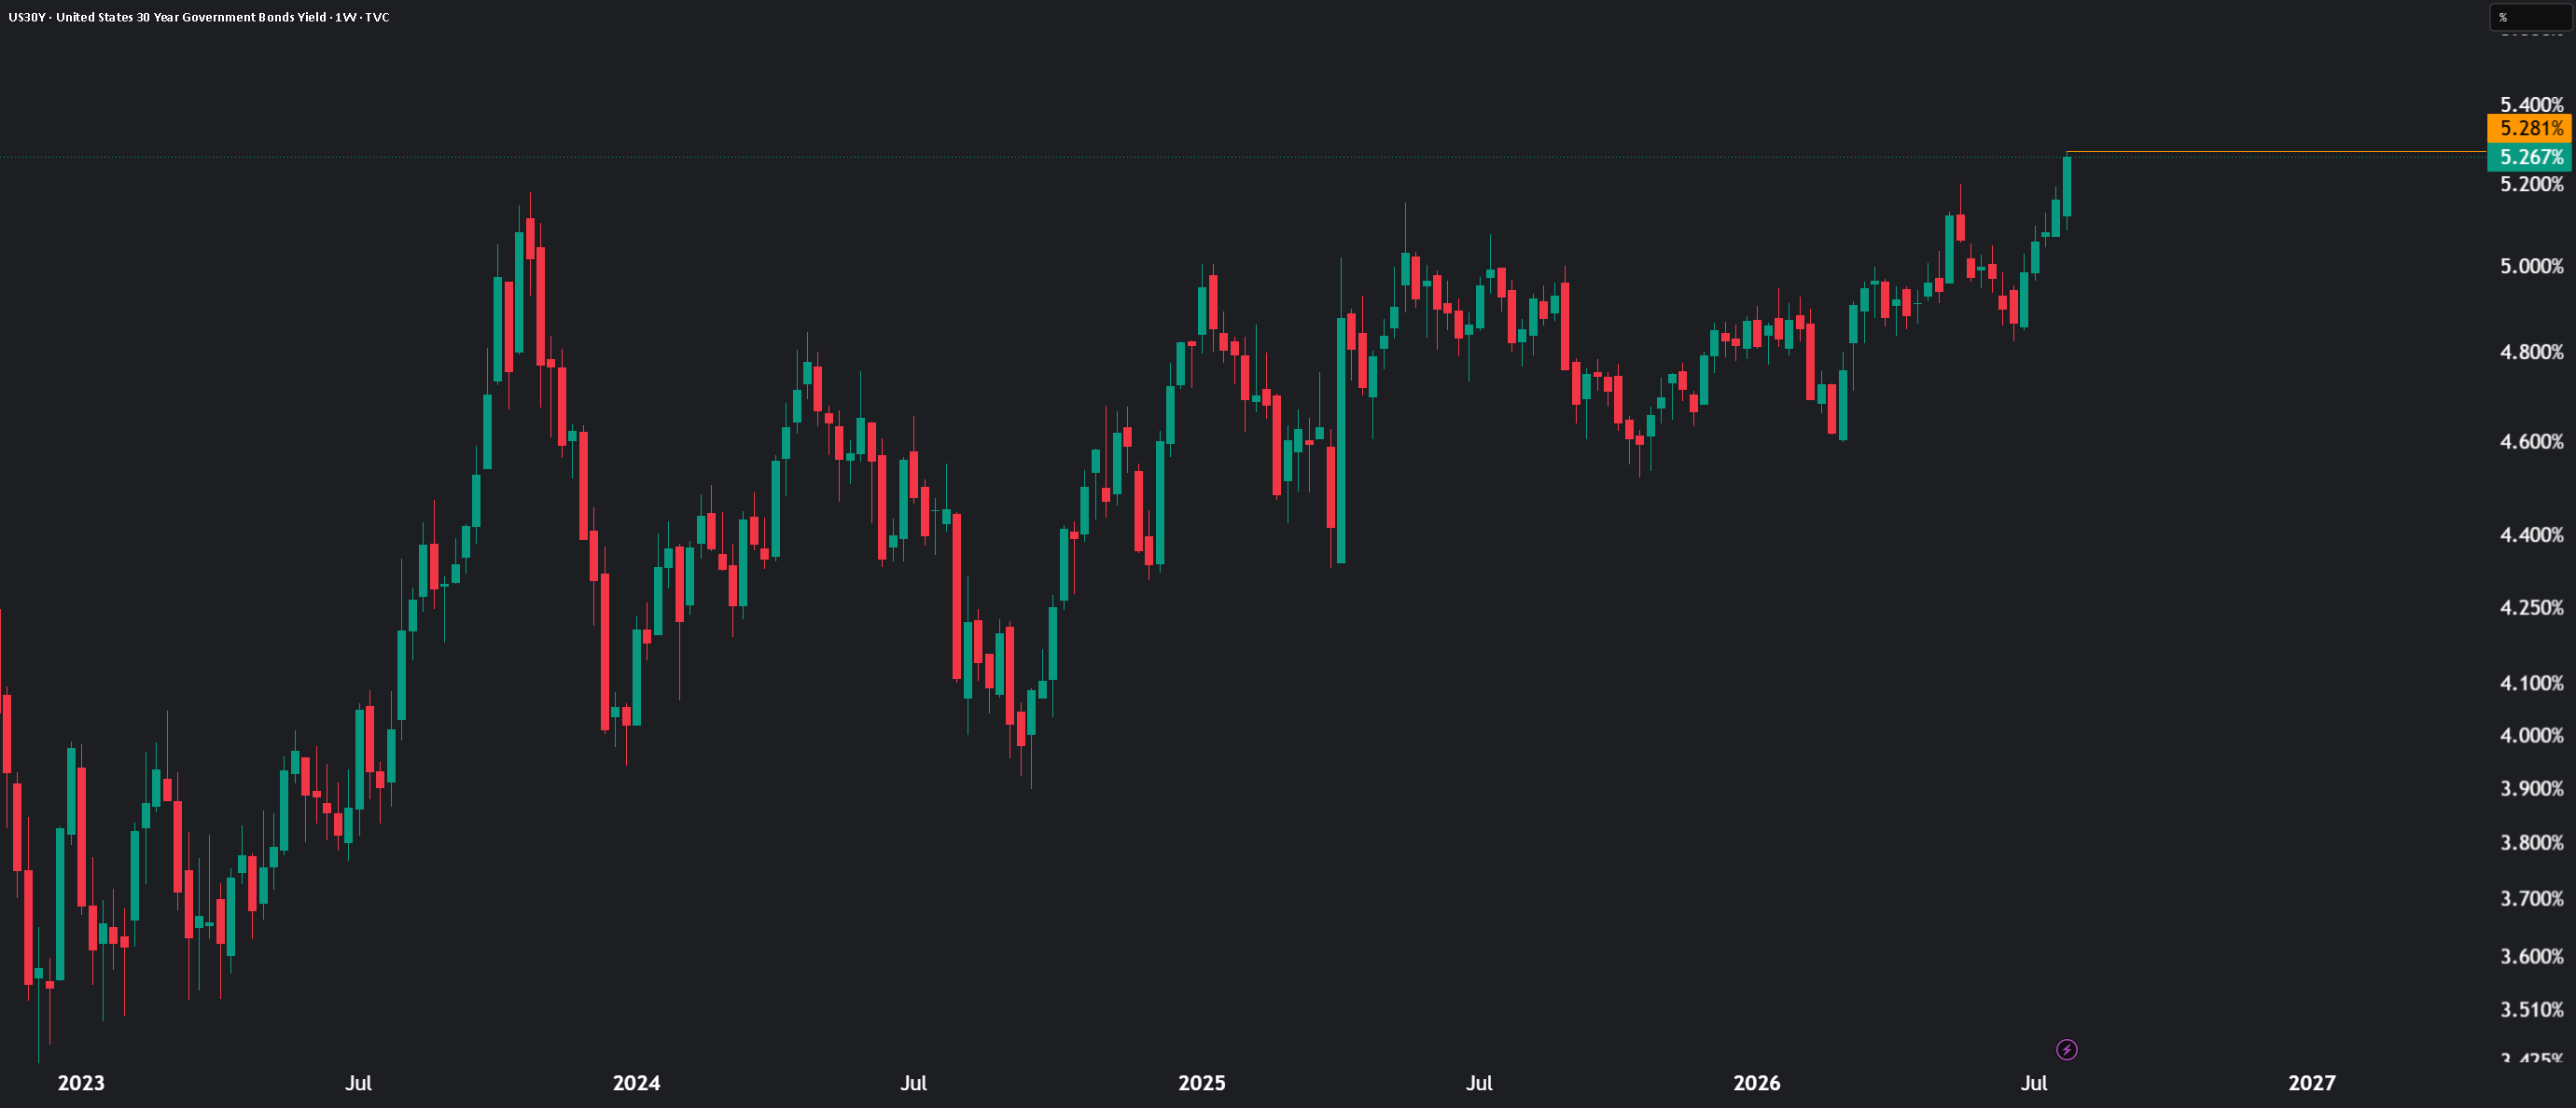
Many investors spend their days analyzing stocks but overlook a chart that influences virtually every market: the 30-Year U.S. Treasury yield (TVC:US30Y on TradingView).
In my view, it is one of the best barometers of the long-term cost of capital.
When yields rise, companies face higher financing costs, valuations become more demanding, and growth-sensitive sectors such as technology, real estate, and utilities are generally the first to come under pressure. Conversely, a lasting decline in yields often supports risk assets.
THE INDICATORS I USE ON TRADINGVIEW
📈 SMA 200
This is my primary indicator.
• Yield above the 200-day SMA: yields are in an uptrend.
• A rising 200-day SMA: structural pressure remains on bond prices.
• The further the yield moves above its 200-day SMA, the greater the risk of a pullback or consolidation.
☁️ Ichimoku
I mainly monitor:
• the yield’s position relative to the cloud;
• the slope of the Kijun-sen;
• the slope of the leading cloud, especially Senkou Span A;
• the Chikou Span.
A yield that remains above the cloud with a rising Kijun-sen generally reflects a solid trend.
📊 ADX (14)
ADX measures the strength of the move.
• below 20: no clear trend;
• above 25: a trend is developing;
• above 30: a strong trend.
📉 MACD
I mainly look for:
• moves above the zero line;
• signal-line crossovers;
• divergences.
MACD often helps filter false signals when yields move in a directionless market.
📦 Volume Profile
Even though the yield itself has no true traded volume, Volume Profile can still highlight the price zones where the market has spent the most time.
I pay particular attention to:
• the Point of Control (POC);
• High Volume Nodes (HVNs);
• Low Volume Nodes (LVNs).
📐 Linear Regression
This is very useful for judging whether yields are trading near the center of their trend or in an overextended area.
📏 ATR
ATR simply measures volatility.
A simultaneous rise in ATR and ADX often confirms an acceleration in the trend.
WHAT ELSE I MONITOR
I regularly compare the 30-year yield with:
• the 10-Year U.S. Treasury yield;
• the S&P 500;
• the Nasdaq;
• the U.S. Dollar Index (DXY);
• gold.
This cross-market view often makes sector rotations easier to understand.
MY DASHBOARD
⭐ 200-day SMA
⭐ Ichimoku
⭐ ADX
⭐ MACD
⭐ Volume Profile
⭐ Linear Regression
⭐ ATR
In my view, following equity indices without monitoring long-term interest rates is like driving without looking several hundred meters down the road.
The bond market often sends the first signals.