
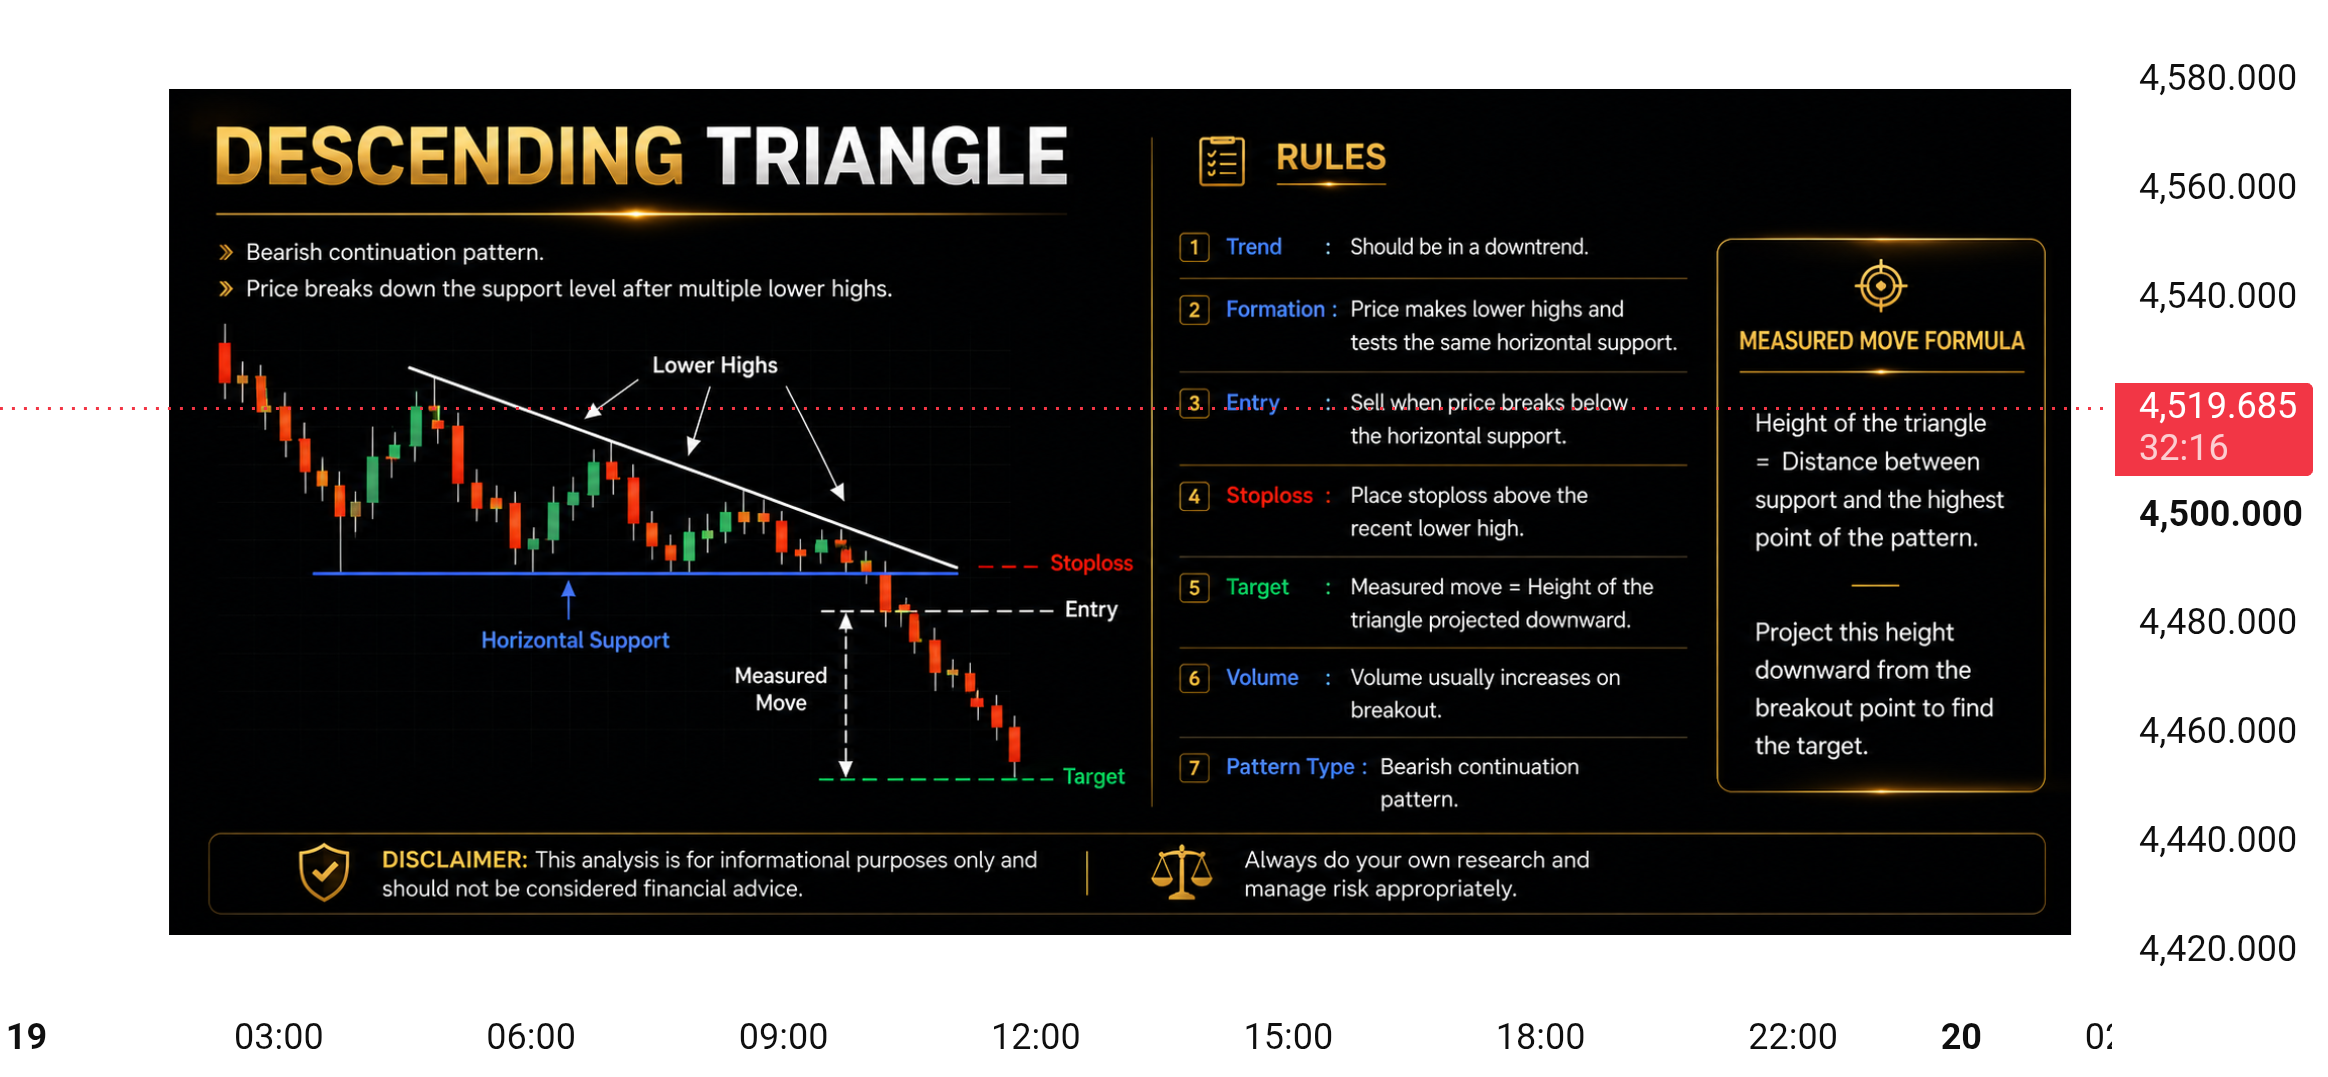
XAUUSD is currently displaying a descending triangle formation on the 1-hour timeframe. From a technical perspective, the structure is defined by a sequence of lower highs developing beneath a descending trendline, while price continues to interact with a relatively consistent horizontal support zone.
Market Structure
The formation suggests that sellers have progressively appeared at lower price levels, creating a series of declining swing highs. At the same time, the repeated reactions around horizontal support indicate that buyers have continued to defend the same general area.
This combination creates a compression structure in which price is gradually moving toward the apex of the triangle. The key technical question is whether price can establish a sustained move outside the formation.
Support & Breakout Confirmation
The horizontal support area is the primary reference level for this setup. A decisive candle close below support, followed by continued acceptance beneath the level, would provide stronger confirmation that the triangle is resolving to the downside.
A brief intraday move below support without follow-through should be treated cautiously, as it could represent a false breakout. Additional price-action confirmation can therefore help distinguish a genuine structural breakdown from temporary volatility.
Measured-Move Concept
The chart illustrates the traditional measured-move approach for a descending triangle. The approximate height of the formation can be measured between the upper boundary and the horizontal support, then projected downward from the confirmed breakout area.
This projection should be viewed as a technical reference rather than a guaranteed destination. Actual price movement can differ depending on momentum, liquidity, volatility, and broader market conditions.
Invalidation & Alternative Scenario
If price continues to hold above the horizontal support and moves back through the descending trendline, the bearish interpretation may weaken. A sustained recovery above the pattern’s upper boundary would require reassessment of the current structure.
The pattern therefore remains conditional until price provides a meaningful breakout and confirmation.
Technical Takeaway
The descending triangle represents a potential bearish continuation structure, but the pattern itself does not guarantee a particular outcome. The most important factors to monitor are the horizontal support, the descending trendline, breakout strength, candle closes, and follow-through after any structural break.
This analysis is based solely on technical price structure shown on the chart and should not be interpreted as a guaranteed market prediction or a recommendation to buy or sell.
Disclaimer: This content is provided for informational and analytical purposes only. It is not financial advice, investment advice, or a solicitation to trade. Markets involve risk, and past price patterns do not guarantee future results. Always conduct your own research and make independent decisions.