
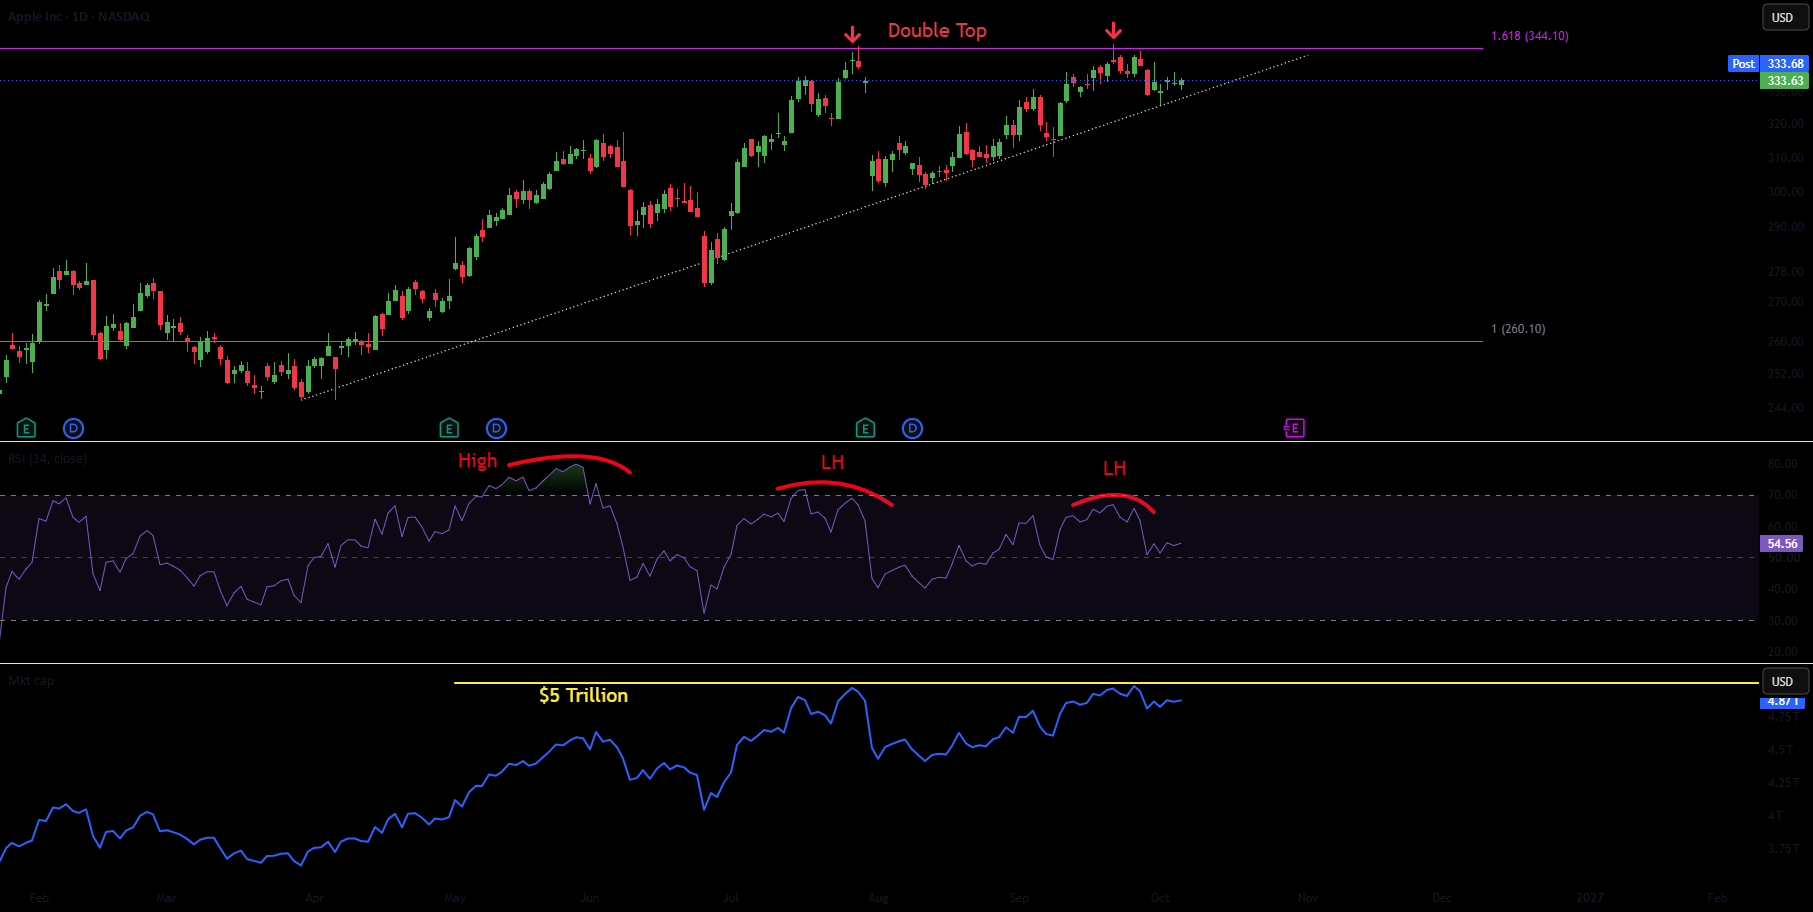
Apple has just reached a very significant milestone, and at the same time it is building the market structure for a very large move.
Apple hit a $5 trillion market capitalization on July 28th. After reaching that milestone, Apple saw its first significant drop, falling 13% over the next few days. Price then recovered and rallied all the way back to the $5T level on September 22nd, where a second top formed right around the same high as the first.
The Double Top
In terms of price action, this represents a double top, with the second top coming in less than a dollar above the first. At the same time, a bearish divergence is beginning to emerge on the daily RSI. Price has continued climbing higher while the RSI has continued printing lower highs (LH).
This matters because the RSI measures the strength of momentum behind each move. When price makes a higher high but momentum makes a lower high, it means each push higher is happening with less underlying buying force than the one before. The rally is still advancing but buyers are starting to run out of strength even though price has not yet turned.
The Fibonacci Level
The other thing to note is the 1.618 extension target I have outlined. This level is derived from the Fibonacci trend running from the December 2024 swing high to the January 2023 swing low. Price has continued to respect this level as a region to take profits.
The Higher Timeframe Picture
Apple is still a very strong company with great fundamentals. However, that does not change the fact that the market does what the market does, and great companies can still have significant pullbacks. At the moment, the daily chart is aligning for a significant pullback based on the technicals.
If you zoom out to the higher timeframes, the weekly and 2-week RSI are also reaching overbought territory, which usually marks some form of local top, so be aware of that as well.