
🟢 Overall Bias
Neutral Bullish (Short-Term) | Mixed Multi-Timeframe
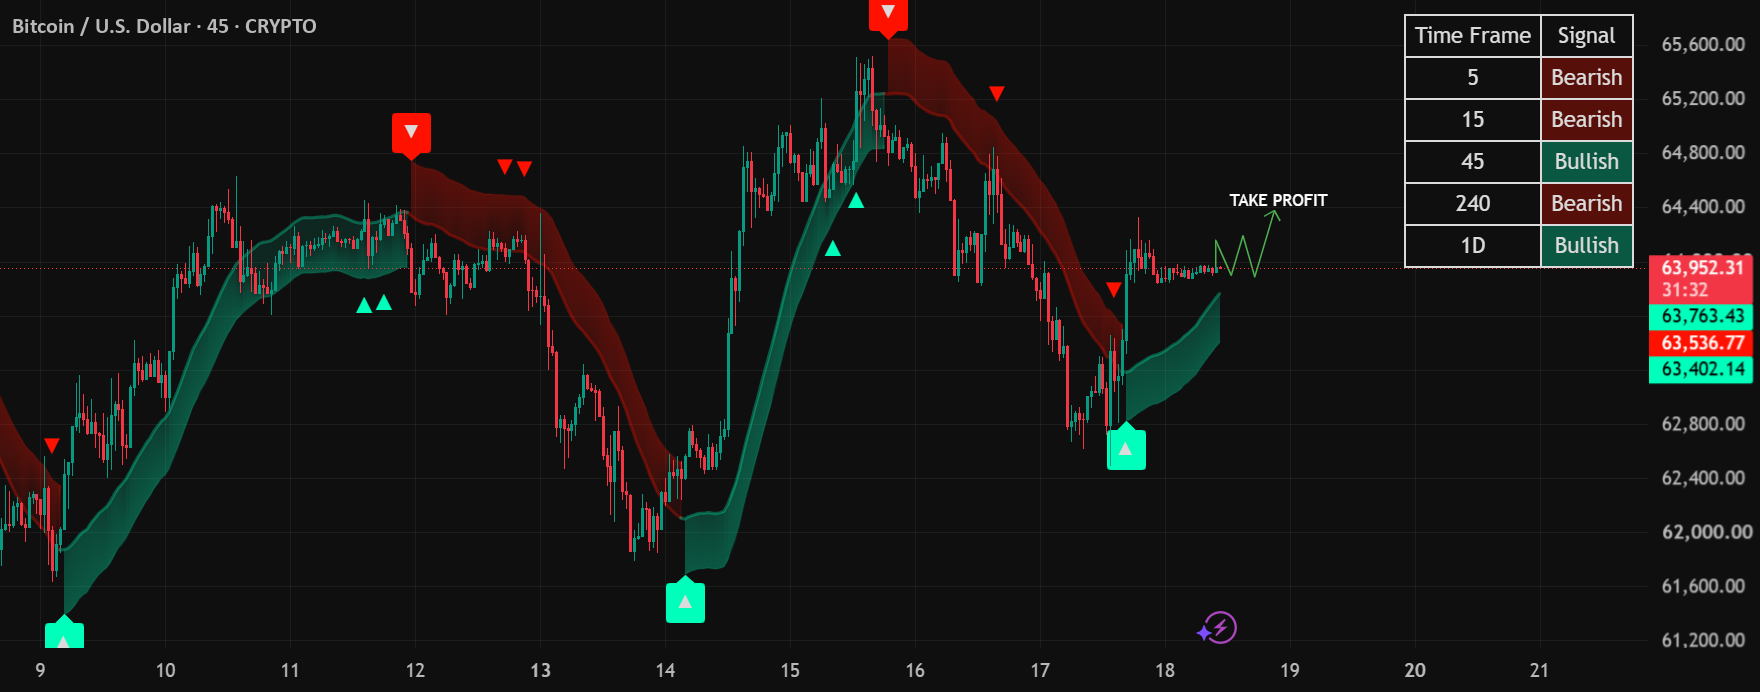
The market has printed a strong bullish reversal after the sharp selloff around July 17. Buyers defended the lows aggressively, creating a higher low followed by an impulsive recovery.
However, price is now approaching an important resistance zone where sellers previously entered.
📈 Multi-Timeframe Signal
Timeframe Trend Strength
5M 🔴 Bearish Weak
15M 🔴 Bearish Weak
45M 🟢 Bullish Moderate
4H 🔴 Bearish Strong
Daily 🟢 Bullish Strong
Interpretation
Lower timeframes are experiencing a pullback.
45-minute trend has turned bullish.
4H remains inside a corrective bearish phase.
Daily trend is still positive.
Overall: Mixed market with bullish intraday potential.
Market Structure
Current Structure
✅ Higher Low formed
✅ Bullish impulse
✅ Consolidation under resistance
Price is currently compressing, which often precedes a breakout or rejection.
📊 Dynamic Trend Cloud
Cloud Status
Current price is trading:
✅ Above the green cloud
Cloud is beginning to slope upward, suggesting:
Buyers gaining control
Trend improving
Dynamic support building
This is constructive for bulls.
🔴 Resistance Levels
Immediate Resistance
64,150 – 64,250
First breakout confirmation.
Major Resistance
64,500 – 64,800
Previous rejection area.
Heavy selling expected here.
Extreme Resistance
65,200
Previous swing high.
A break above would strengthen the bullish case.
🟢 Support Levels
Immediate Support
63,760
(Current cloud support)
Strong Support
63,500
Loss of this level weakens bullish momentum.
Major Support
62,800
Recent demand zone where buyers stepped in.
📉 Volume Perspective
Although volume isn’t visible, price action suggests:
Strong buying after the selloff
Sellers becoming less aggressive
Healthy consolidation instead of panic selling
This favors continuation if buyers remain active.
📌 Price Action
Current candles show:
Small-bodied candles
Reduced volatility
Sideways movement
This often indicates accumulation before the next move.
🚀 Bullish Scenario
A confirmed close above:
64,200
could trigger a move toward:
🎯 64,500
then
🎯 64,800
followed by
🎯 65,200
Probability: 65–70% if support holds.
🔻 Bearish Scenario
If price loses:
63,760
expect:
63,500
↓
63,200
↓
62,800
A break below 62,800 would invalidate the short-term bullish recovery.
Probability: 30–35%
📈 Trade Setup (Educational Example)
🟢 Long Setup
Entry: Above 64,200 (after breakout confirmation)
Stop Loss: Below 63,700
Target 1: 64,500
Target 2: 64,800
Target 3: 65,200
🔴 Short Setup
Entry: If price is rejected near 64,200–64,500 with bearish confirmation.
Stop Loss: Above the rejection high.
Target 1: 63,760
Target 2: 63,500
Target 3: 62,800
🏷️ Professional Trading Tags
#BTCUSD
#Bitcoin
#CryptoTrading
#TechnicalAnalysis
#PriceAction
#MarketStructure
#SupportAndResistance
#TrendFollowing
#SwingTrading
#DayTrading
#BreakoutTrading
#RiskManagement
#BullishSetup
#BearishSetup
#TradingView
⭐ Final Verdict
Bias: 🟢 Cautiously Bullish
The chart shows a short-term bullish recovery with price holding above rising dynamic support. However, resistance around 64,200–64,500 is a critical decision zone. A confirmed breakout above this area would favor continuation toward 64,800–65,200, while failure to hold 63,760 would increase the likelihood of a pullback toward 63,500 and 62,800. Waiting for confirmation at these key levels offers a more favorable risk-to-reward profile than entering during the current consolidation.