
🔍 1. Technical Analysis
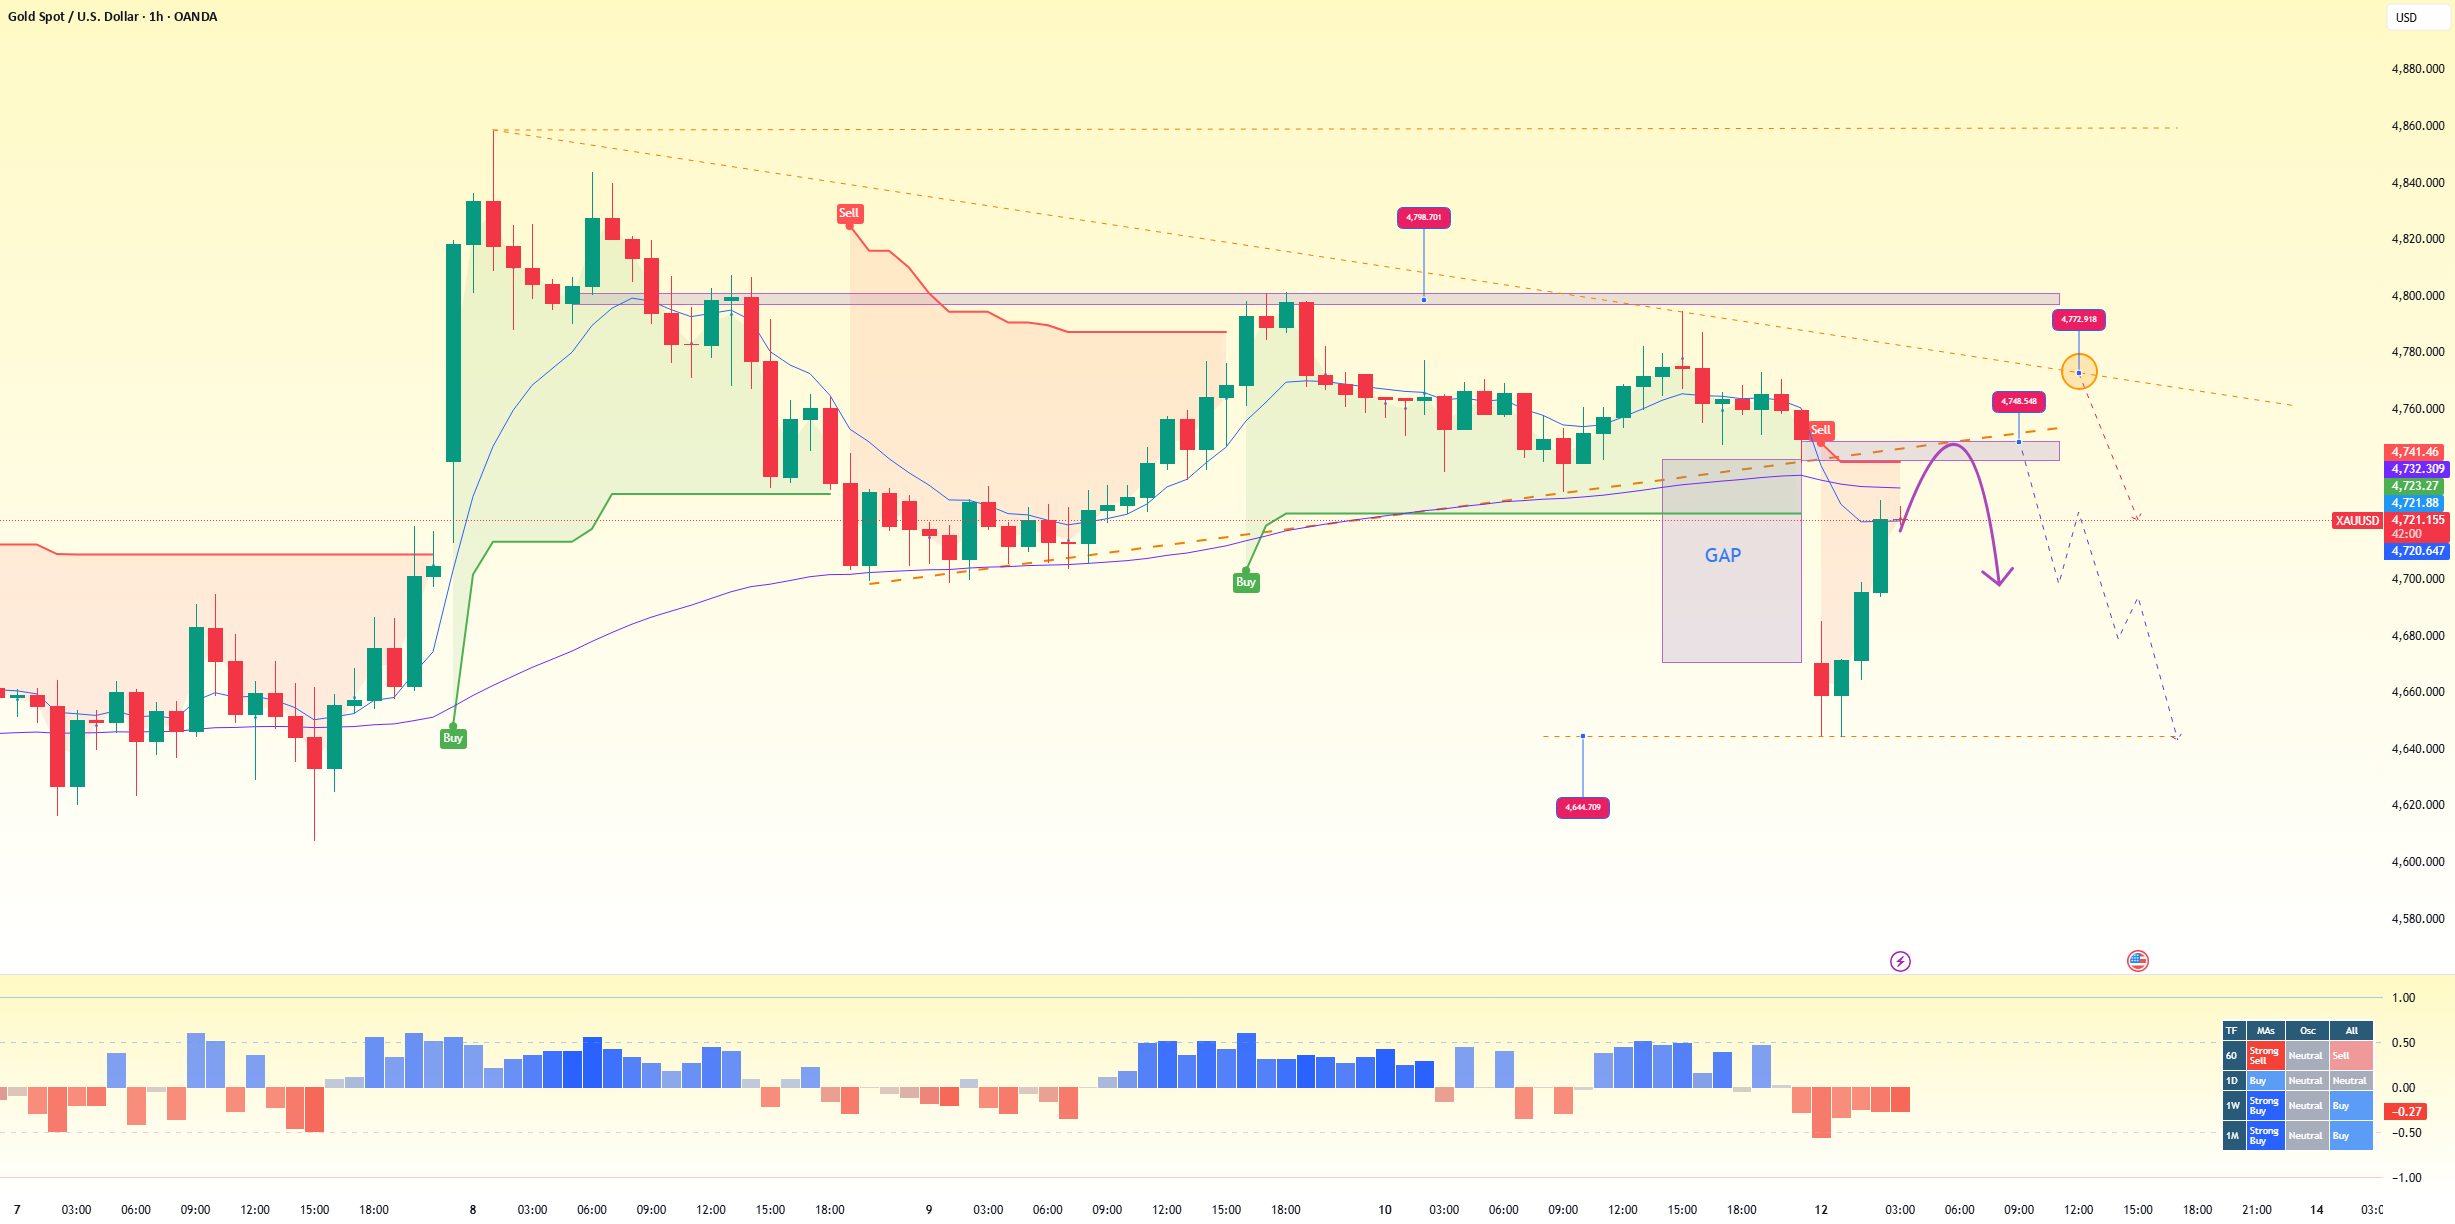
📈 Trend & Structure
Previous trend: bullish → now weakening
Price has been rejected at the resistance zone 4.78x – 4.80x
A lower high has formed
Slight breakdown below the short-term structure
👉 Overall:
The market is shifting from bullish → sideways → slightly bearish
Currently in a distribution phase / preparing for a potential decline
🧠 Key Structure Insights
There is a GAP (imbalance zone) below → price tends to move back to fill it
👉 Implication:
This is no longer a simple pullback
It signals the early stage of a new bearish leg
📊 Key Levels
🔴 Resistance (Sell Zone)
4.74x – 4.76x (recent retest)
4.78x – 4.80x (major resistance)
🔵 Support (Downside Targets)
Short-term: ~4.70x
Key zone:
4.68x – 4.66x (GAP + demand)
Deeper level:
~4.64x (liquidity zone)
🌍 2. Macro Analysis (Gold / USD)
🏦 Fed Policy & USD
The Fed maintains a “higher for longer” stance
Inflation (CPI / PCE) remains elevated → not enough to justify easing
👉 Impact:
Strong USD
➝ Downward pressure on Gold
📊 Bond Yields
Yields remain elevated
👉 Implication:
Reduces the appeal of non-yielding assets like Gold
➝ Bearish for Gold
3 Signal
SELL GOLD ZONE : 4747 – 4750 SL : 4755
TP : 4730 – 4712 – 4688
It is necessary to be flexible and adapt to actual price fluctuations throughout the day.