
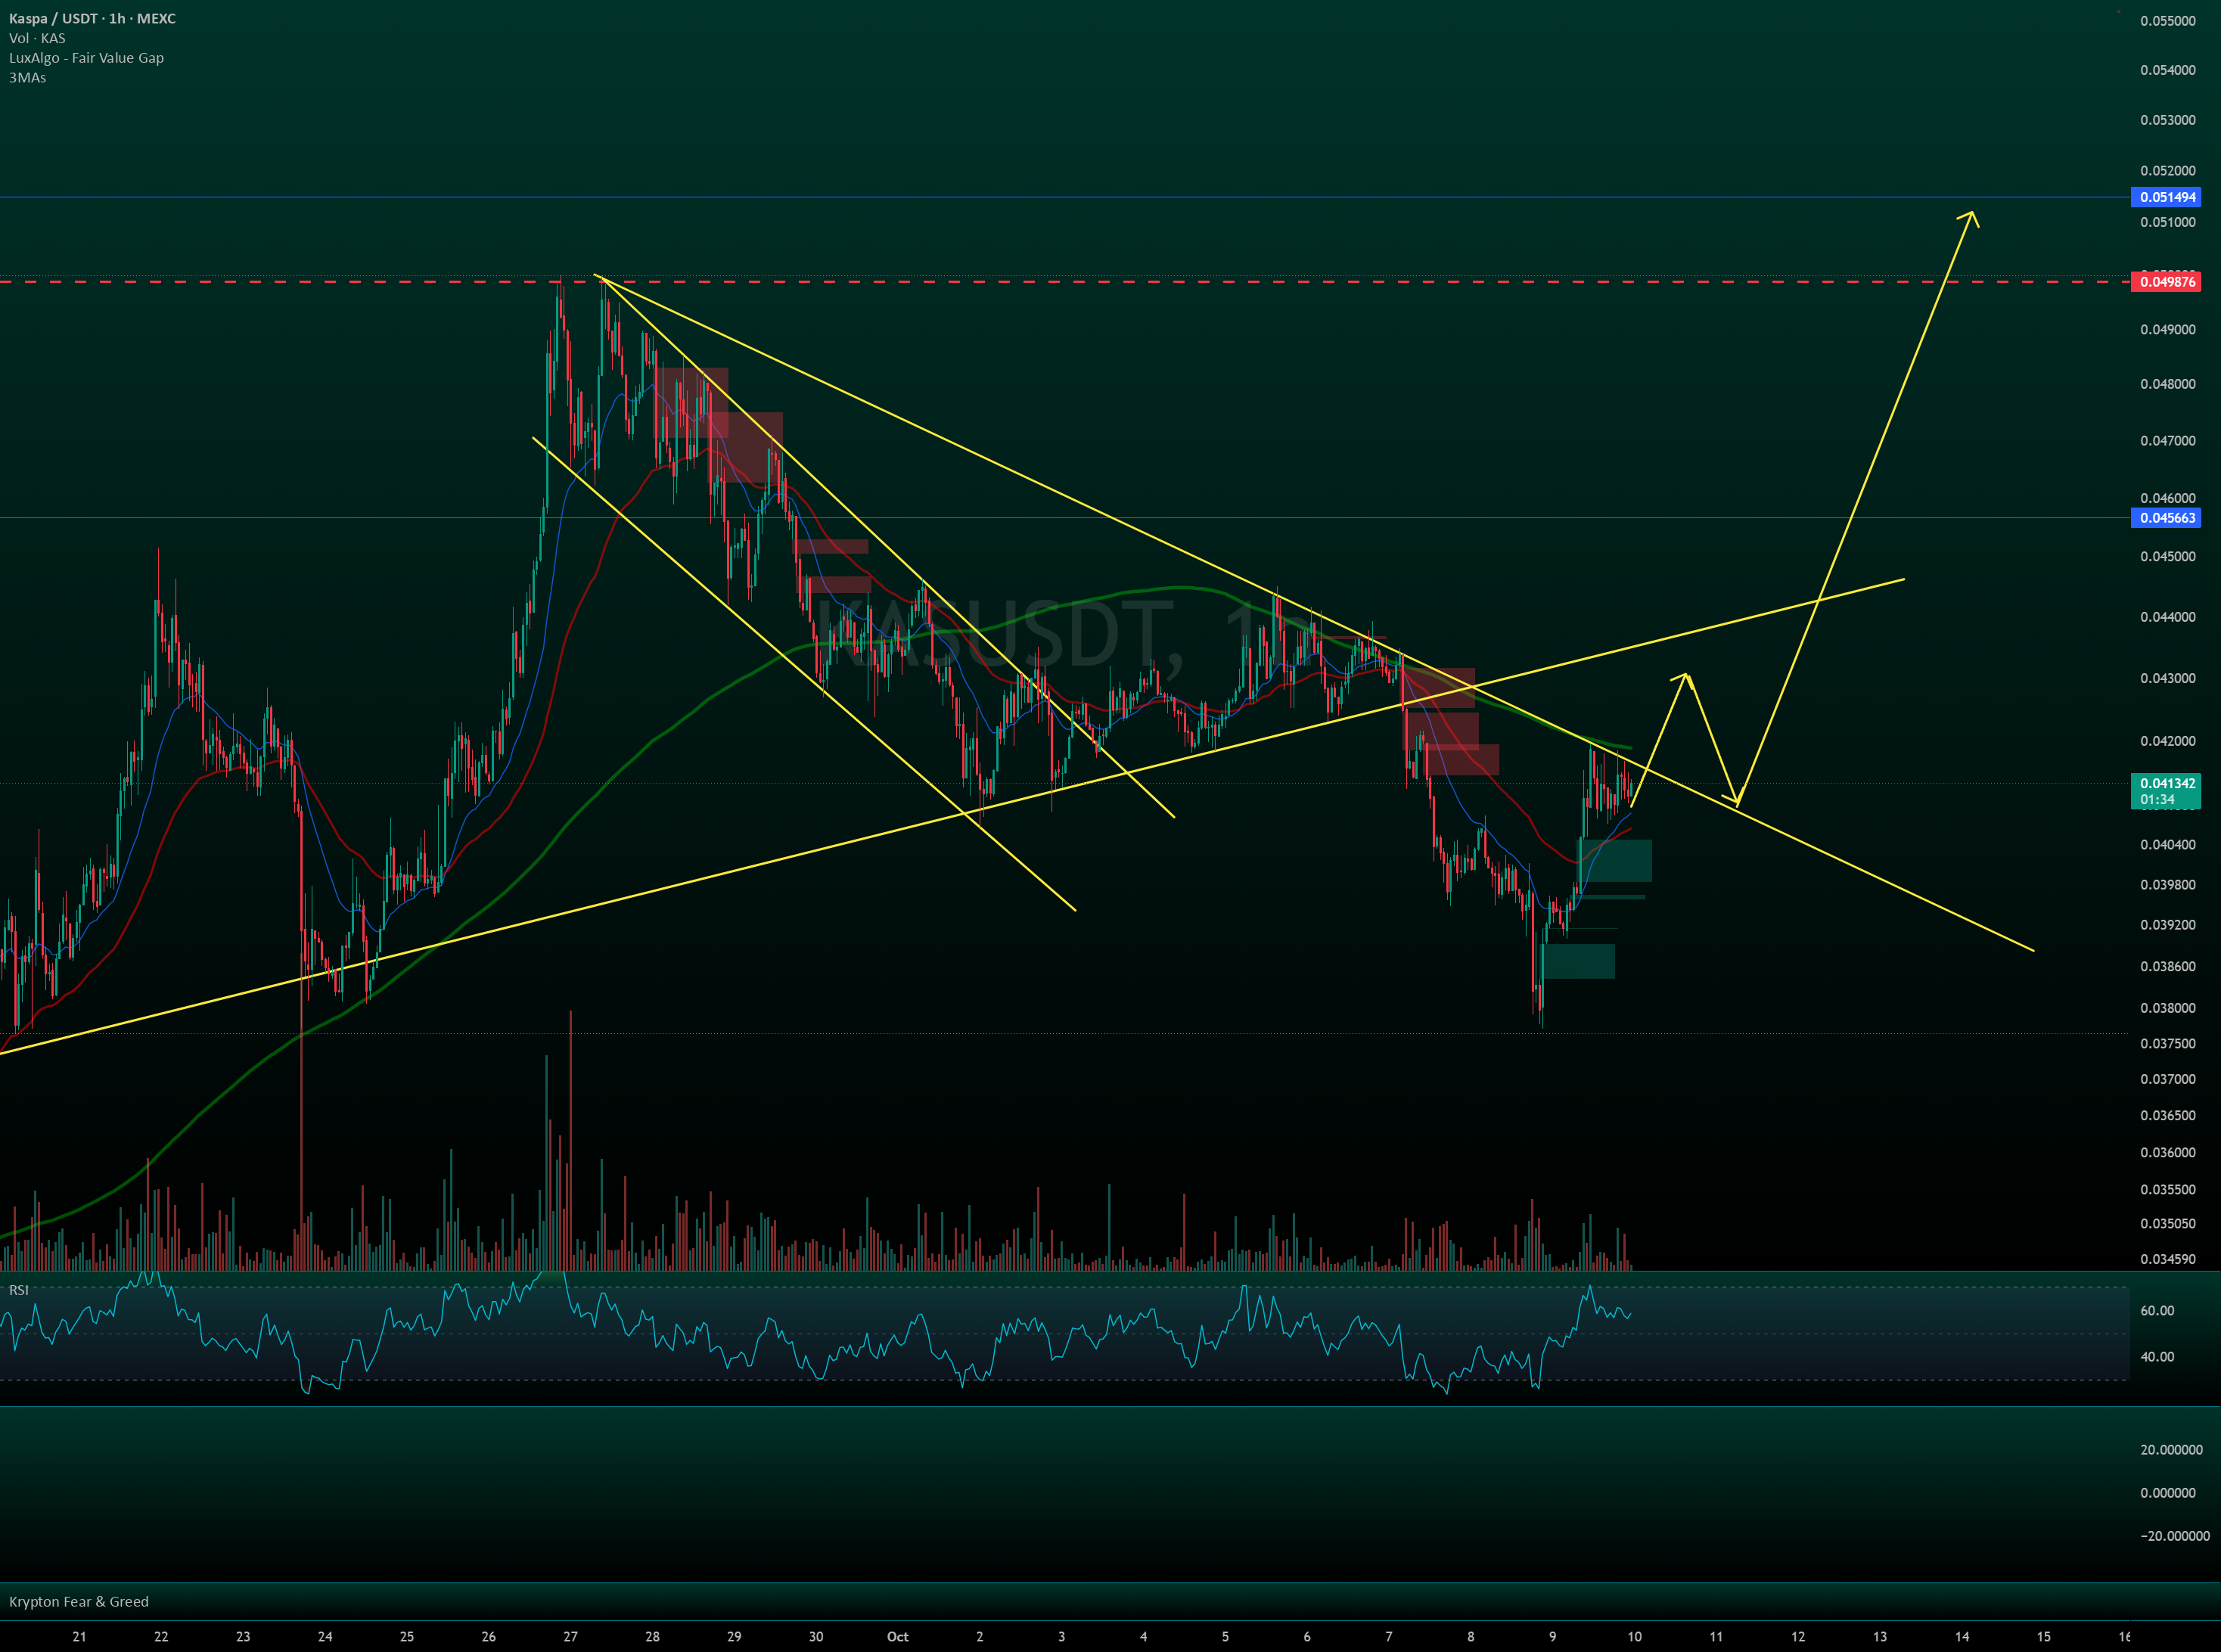
💠 Kaspa bounced hard off the lows and is now leaning on the falling trendline, like someone knocking on a door it already broke once.
KAS technicals:
🔼 Price bounced from the 0.038000 area, the green zones under price held, and right now it sits at 0.041310. It is above the blue and red moving averages, and RSI has turned up into the 60s. The descending trendline from the top and the green MA sit right on top of price, with the red supply boxes from the breakdown just above. My base case is one more push into 0.043, then a retest from above of the descending trendline. If that line holds as support, the way opens to 0.045663, then 0.049876 and 0.051494, where liquidity sits above.
🔽 Worst case: no hold on the retest, price slips back into the green zones near 0.040000, and losing them puts the 0.038000 low back in play. Keep it on the radar.
Long bias stays on while price holds above the green zones and the recent low.
✔️ Targets: 0.045663, 0.049876, 0.051494
❌ Invalidation: close below the 0.037500 area, under the recent low
Risk: analysis, not financial advice. Trade with a stop, risk per trade 1-2% max.