
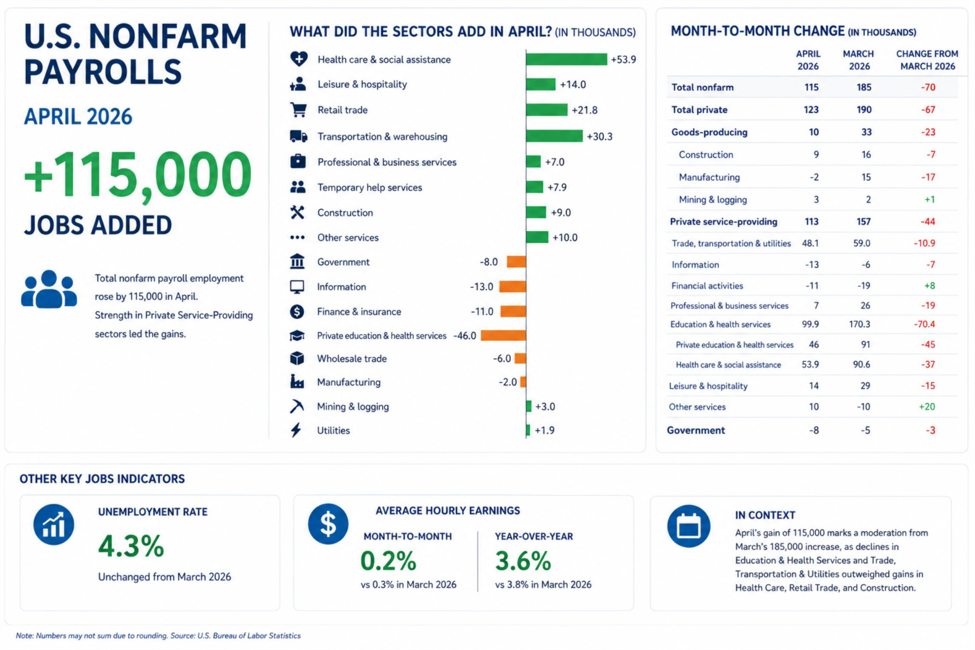
The USD moved briefly higher following the better-than-expected U.S. jobs report, but the broader market reaction has since turned more risk-positive than dollar-supportive. Nonfarm payrolls rose by 115K versus expectations of 62K, while the unemployment rate held steady at 4.3% as expected. Average hourly earnings increased 0.2% month-over-month and 3.6% year-over-year — a mixed outcome that still points to lingering wage inflation pressures, but not enough to significantly alter Fed expectations. Meanwhile, the average workweek ticked up to 34.3 hours from 34.2, adding another modestly constructive detail to the report.
Overall, the data reinforced the view that the labor market remains resilient without forcing the Federal Reserve toward a more aggressive policy stance. Market pricing appears to be leaning toward the idea that the Fed can remain patient, especially if geopolitical tensions ease and energy-driven inflation pressures begin to moderate. Stocks are trading higher following the release, while Treasury yields are modestly lower, with the 2-year yield down 2.6 basis points and the 10-year yield down 2.2 basis points.
Looking at the major currency pairs:
EURUSD:
The EURUSD dipped to support near 1.1754 — the minimum downside target outlined earlier — before rebounding back toward yesterday’s high near 1.1778. The pair remains trapped within a relatively narrow range, with traders awaiting the next directional break. On the topside, a move above 1.1784 and then 1.17956 would open the door toward April highs between 1.1823 and 1.1836, followed by 1.1848. On the downside, a break below 1.1754 would shift focus toward the key moving average cluster near 1.1728 (100-hour MA), 1.1719 (200-hour MA), and 1.17075 (100-day MA).
USDJPY:
The USDJPY moved higher after the report and tested the 100-hour moving average at 156.87, but sellers leaned against that resistance level and forced the pair back lower. The price is now retesting the 50% midpoint of the recent trading range at 156.50. A break below that level would give sellers greater confidence and increase downside momentum potential. On the topside, a move back above the 100-hour moving average would target the 100-day moving average near 157.35.
GBPUSD:
The GBPUSD continues to hold above the key swing area between 1.3575 and 1.3602, keeping buyers in near-term control. The North American session low reached 1.35977 before rebounding higher. The next upside target comes against yesterday’s high at 1.36317. Above that level, traders will look toward Wednesday’s high near 1.3643, followed by last week’s high at 1.36569.
USDCAD:
The USDCAD is moving sharply higher as stronger U.S. jobs data combines with weaker Canadian employment numbers to support the pair. The price has broken above a swing level at 1.3666 and is now approaching the 38.2% retracement of the decline from the March 31 high at 1.3708. Additional resistance comes in between 1.37089 and 1.37149, while the 100-day moving average near 1.37203 remains another key technical hurdle that buyers would need to break to strengthen the bullish bias further.
USDCHF:
The USDCHF initially moved modestly higher after the report but has since reversed lower, trading near a new session low around 0.7771. That level also represents the 61.8% retracement of the 2026 trading range rally from the January 28 low to the early-April high. Yesterday, the pair briefly broke below that support level before snapping back higher and retesting the 100-hour moving average during the Asian-Pacific session. However, sellers regained control and rotated the pair back to the downside. Sellers remain in control technically, but they need to maintain momentum below the 0.7771 level to reinforce the bearish bias.