
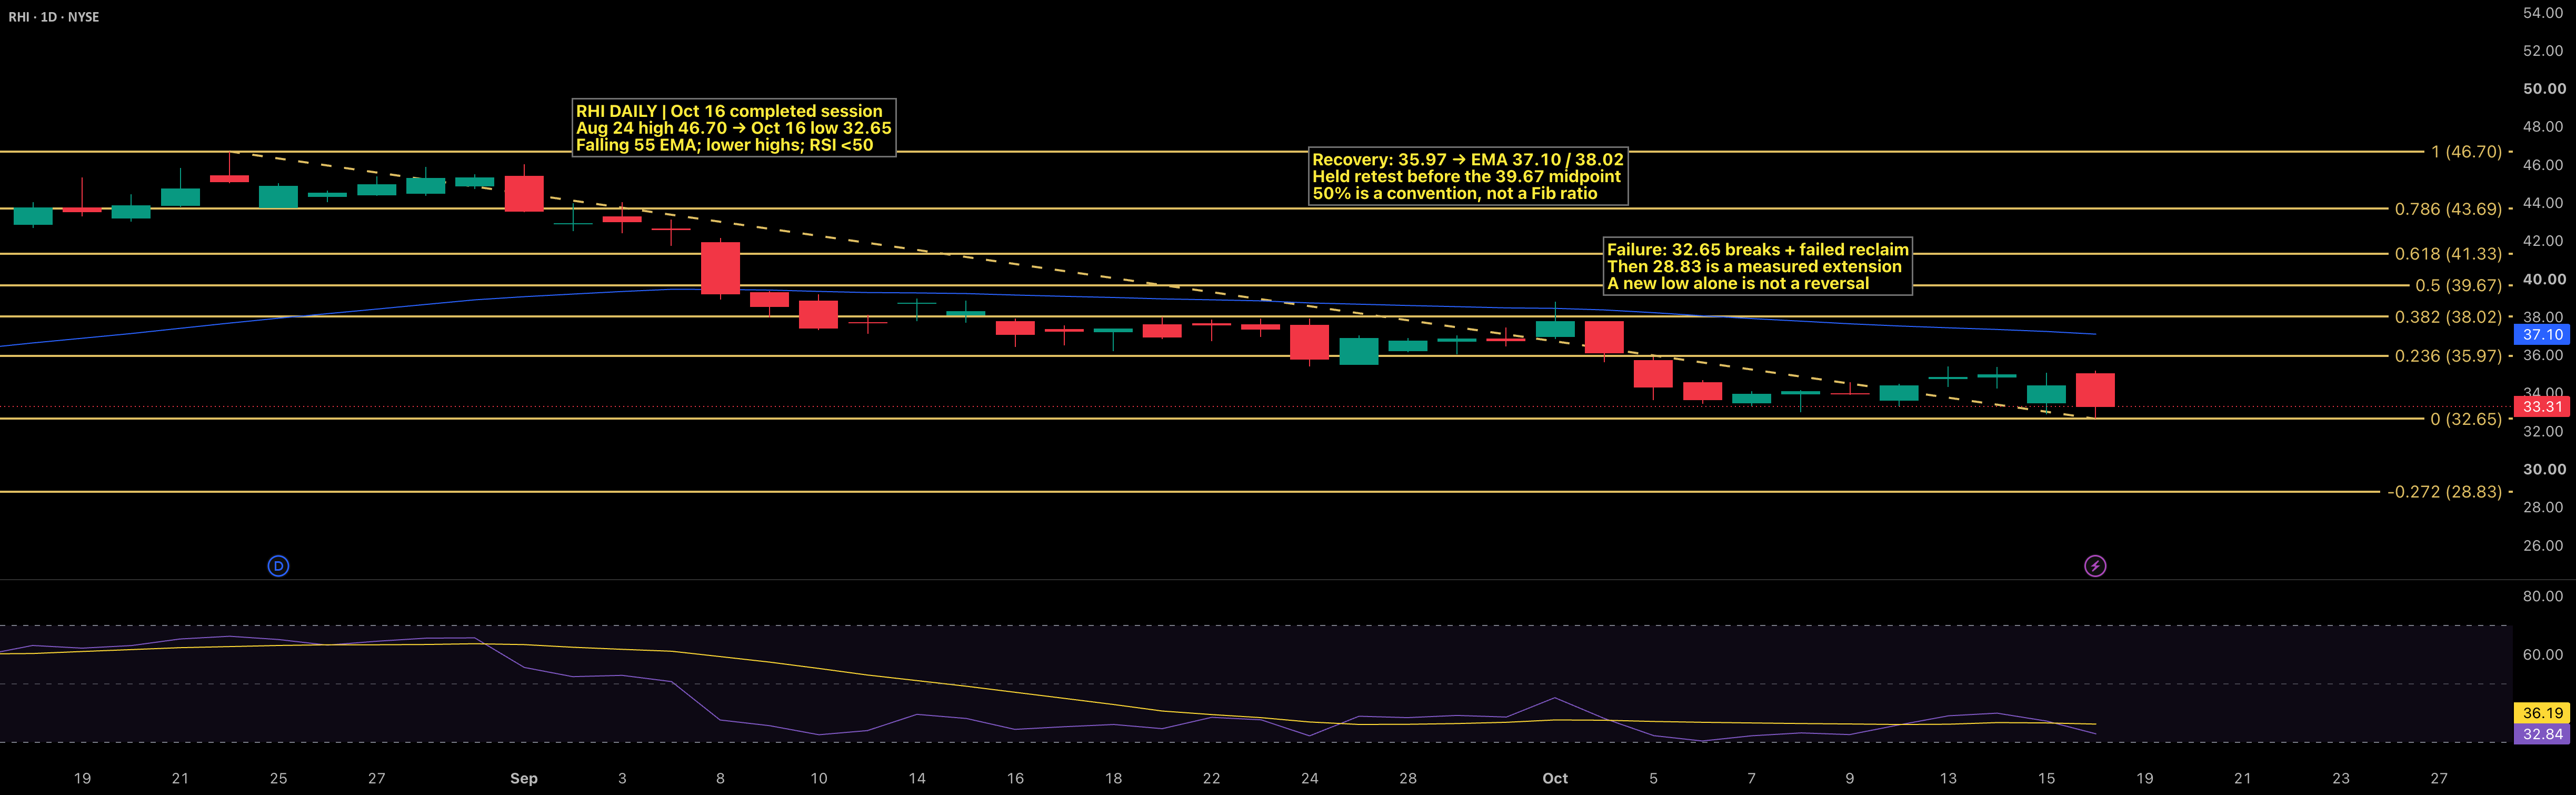
A Fibonacci map can organize a falling stock without making the newest low a buying signal. Robert Half’s daily chart provides a concrete example: a visible sequence of lower price areas, a falling 55 EMA and a new low at the end of the selected decline. The task is to define what a recovery would have to accomplish, rather than assume that a large measured decline is enough.
Macro and fundamental context — identify the business before the ratio
Robert Half operates in specialized staffing and consulting. Hiring decisions and client budgets are therefore relevant research channels, but a broad economic headline cannot quantify this company’s next quarter. Its July 23 release covered the quarter ended June 30: revenue was $1.336 billion versus $1.370 billion a year earlier, and diluted EPS was $0.26 versus $0.41. Management reported sequential improvement in adjusted talent-solutions revenue. That statement and lower year-over-year enterprise revenue can coexist because their comparison periods and measures differ.
Those are historical disclosures, not new earnings on October 16. A business argument about a possible recovery needs a separate check against subsequent operating evidence. A falling share price does not prove one particular revenue cause, and a constructive management statement does not establish that the next retracement will hold. Keep the financial comparison and the chart condition on separate lines of reasoning.
Choose and name the swing
This genuine daily chart was captured October 16 around 16:09 Chicago, after the regular session. The completed candle opened at 35.04, reached 35.19, fell to 32.65 and closed at 33.31. The plotted 55 EMA was approximately 37.10 and RSI 32.84. This is a dated completed-bar teaching example, not an after-hours quote or a claimed entry.
The drawing measures the August 24 high of 46.70 down to the October 16 low of 32.65. Both endpoints and the intervening daily history remain visible. The range is 14.05 points. These anchors measure the displayed decline, rather than a short intraday bounce nested inside it. Selecting a different swing changes the arithmetic and should be stated as a different analysis.
For this orientation, the recovery ladder starts at the low. Add the chosen fraction of 14.05 to 32.65. The 23.6% reference is 35.9658, displayed as 35.97. The 38.2% reference is 38.0171, displayed as 38.02. The exact halfway calculation is 39.675; the native drawing displays 39.67. The 61.8% and 78.6% references display 41.33 and 43.69, followed by the original 46.70 high. Fifty percent remains a midpoint convention, not a Fibonacci ratio.
The downward extension subtracts 0.272 times the same range from the low: 32.65 minus 3.8216 equals 28.8284, displayed as 28.83. It is a measured reference if the low fails, not a forecast or a guarantee that price must reach it. A decimal label on a drawing does not assign a probability to a candle reaction.
Read the candle and trend before naming a reversal
The October 16 candle has a red body from 35.04 to 33.31, and its close is only 0.66 above the low. It does not regain the 35.97 recovery reference. Price also remains below the falling average. Those observations support describing an unrepaired decline on this daily map; they do not prove that every following session must be negative.
RSI near 32.84 describes weak recent momentum. A low reading alone does not identify the turning point. A market can remain weak while an oscillator is low, and a small green candle can appear without reversing the broader sequence. The average and RSI both use price history, so agreement between them should not be counted as two independent experiments establishing a success rate.
Two conditional routes, with the evidence named in advance
For repair, first study whether 32.65 holds and whether a recovery through 35.97 survives a return test on the observation timeframe you chose beforehand. A completed daily close supplies different evidence from an intraday wick. The evolving 55 EMA near 37.10 and the 38.02 recovery reference form the next comparison area. Only after acceptance through that area does the midpoint around 39.67 become the next useful test, followed by 41.33 and 43.69. They are sequential obstacles, not an instant target list.
For failure, a break under 32.65 followed by an unsuccessful reclaim weakens the immediate low-defense thesis. The 28.83 extension then becomes lower context to evaluate. A recovery above a nearby line that fails its retest is also evidence against that particular reclaim, even if the full measured decline remains drawn. Do not keep moving the condition for being wrong simply because another Fibonacci line exists farther away.
The final step is instrument and risk selection. A stock chart does not quantify an option’s expiry, volatility or liquidity. Nor does a short chart distance guarantee a nearby executable exit. Define the maximum affordable loss and thesis failure before quantity; gaps and slippage remain possible. No position, fill or expected return is claimed.
What would change your reading of this decline first: a brief visit above 35.97, a completed close above it, or a held return test—and on which timeframe would you judge that evidence?