
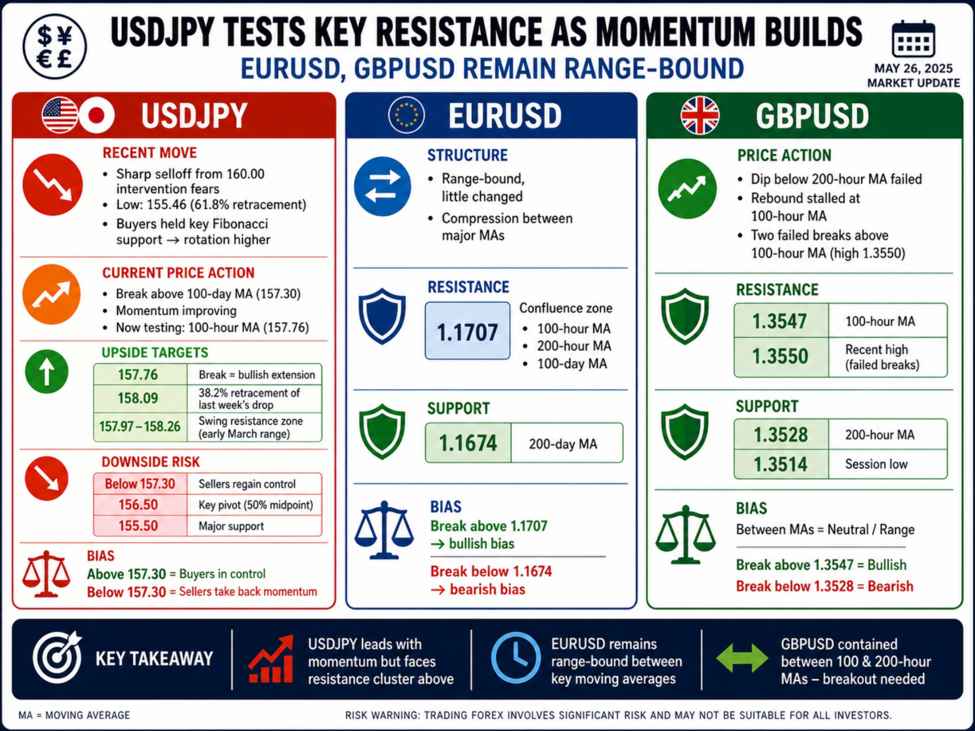
The USDJPY tumbled sharply last week after intervention fears out of Japan surfaced as the pair pushed above the 160.00 level. That warning triggered aggressive selling, driving the price down to 155.46—just ahead of the 61.8% retracement of the move up from the February 12 low (155.505). Buyers leaned against that level, and the pair began to rotate higher.
On the rebound, upside momentum initially stalled near the 100-day moving average. Sellers leaned against that level repeatedly—on Friday, again yesterday, and earlier today—keeping a lid on the rally. Meanwhile, downside corrections held support near the 50% midpoint of the same February move at 156.50, reinforcing that level as a key risk-defining zone for buyers.
Today, the technical picture improved for the bulls as the price finally broke above the 100-day moving average (157.30 area), triggering stronger upside momentum. The rally has now brought the pair into the next key hurdle: the falling 100-hour moving average at 157.76. The market is trading right at that level as North American traders enter, making it the immediate battleground.
A sustained break above the 100-hour moving average would open the door toward 158.09—the 38.2% retracement of last week’s decline—which also sits within a key swing area between 157.97 and 158.26 dating back to early March. That zone represents a cluster of resistance where sellers are likely to re-emerge.
On the downside, a move back below the 100-day moving average would shift control back to the sellers, with momentum likely to refocus on 156.50 and then the 155.50 area.
For EURUSD, price action remains more contained, with the pair trading little changed from yesterday’s close. The key technical zone is defined by a convergence of the 100-hour, 200-hour, and 100-day moving averages—all clustered near 1.1707. That confluence creates a strong resistance ceiling. On the downside, the 200-day moving average at 1.1674 provided support during today’s session. The pair is currently trading between these boundaries, and a break of either side is needed to tilt the bias more decisively.
Similarly, GBPUSD remains range-bound. In the early European session, the price dipped below the 200-hour moving average (1.3528 area) and extended below yesterday’s low near 1.3509, reaching 1.3514. However, sellers could not sustain momentum.
The subsequent rebound pushed the pair back above the 200-hour moving average and up toward the 100-hour moving average at 1.3547. The price briefly traded above that level—peaking at 1.3550—but failed to hold gains on two separate attempts, signaling a lack of bullish conviction.
The pair now trades between the 200-hour moving average near 1.3528 (support) and the 100-hour moving average near 1.3547 (resistance). A break outside this range will be needed to define the next directional bias.
Bottom line:
- USDJPY is testing a key upside pivot (100-hour MA) after reclaiming the 100-day MA—momentum improves above, but resistance clusters loom.
- EURUSD and GBPUSD remain in consolidation mode, with tightly defined ranges and clear breakout levels needed to drive the next move.