
Break open the Buyer’s Bible (which mostly just exists in my brain), and find the Fifth Commandment of my Ten Commandments of Trading…
“The ‘smart money’ doesn’t tell you what it’s doing. Figure it out using the data it leaves behind.”
Institutions, hedge funds, corporate insiders, and strategic investors don’t broadcast their next moves on CNBC.
But they do leave clues behind… The challenge is learning where to look and how to separate meaningful information from the endless stream of market noise.
And that’s what I’m going to show you today.
There are several ways to track what sophisticated investors are doing.
Earnings reports reveal developing trends.
Insider buying and selling provides insight into management confidence.
And institutional ownership reports uncover where large pools of capital are accumulating positions.
While all of these tools have value, two stand out: the options market… and insider ownership.
These provide the earliest indication of how Wall Street is positioning itself.
Let’s Start With Options
Most investors have heard terms like “Whale Reports” or “unusual options activity.” In other words, when volume outweighs open interest.
Here’s the theory…
A large options trade appears, and investors assume someone knows something the rest of the market doesn’t. Maybe it’s an earnings surprise, a product announcement, or another corporate event that has yet to become public.
The reality is far more complicated.
Simply identifying large option volume is not enough.
Was the activity in calls or puts?
Did the volume create new open interest, or was it simply traders closing existing positions?
Was the activity near the current stock price or far out-of-the-money speculation?
How much time remained until expiration?
Without answering those questions, most unusual options activity reports become little more than noise.
More Important Than Volume
One of the profiles I frequently look for appeared earlier this week in Rambus (RMBS).
An unusually large amount of call volume traded at the $60 strike in the June expiration. More importantly, that volume translated into a significant increase in open interest the following day, confirming that new positions had been established.
That distinction matters. Volume tells you activity occurred. Open interest confirms that new money entered the trade.
When large amounts of open interest begin accumulating at a specific strike, that strike often becomes what I refer to as a “Trigger Price.”
Once the stock approaches that level, market makers may be forced to adjust their hedging activity, creating additional buying pressure and increasing the probability of a volatility-driven move.
In the case of Rambus, the $60 strike became the Trigger Price.
After I identified the unusual options activity, the next step was to simply confirm the technical trend.
The stock was already trading in a strong uptrend, momentum remained positive, and the broader semiconductor sector continued attracting institutional capital.
When technical trends and options activity align, the odds of success improve significantly.
The setup played out exactly as expected.
Within 24 hours, shares of Rambus challenged the $60 level and began a sharp move higher.
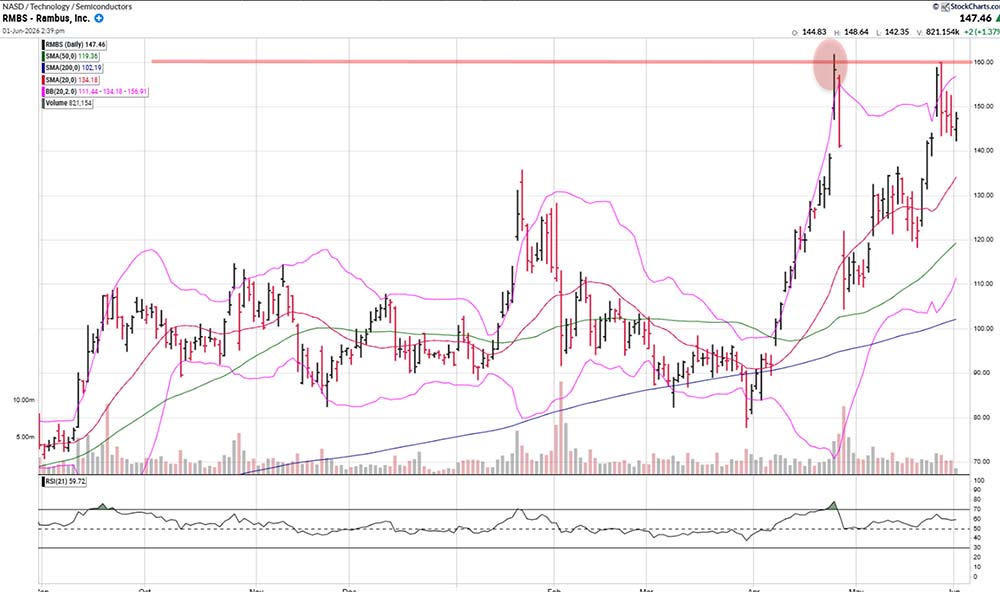
The catalyst arrived when Nvidia (NVDA) CEO Jensen Huang suggested that another semiconductor company could eventually hit the trillion-dollar mark, reigniting enthusiasm throughout the sector.
What interested me wasn’t the headline, it was the positioning that occurred before the news appeared.
More than $6.6 million flowed into those call options before the move.
By the time the market reacted to the news, the positioning was already in place. The trade ultimately generated gains of more than 90% in just two trading sessions.
What did those traders know? Impossible to say. All we know is the smart money aggressively positioning itself before the broader market recognized the opportunity.
Institutional and Insider Activity
The second area I watch closely is insider and institutional ownership activity.
The Rambus trade led me down a rabbit hole after Huang’s comments regarding Marvell Technology (MRVL).
Most investors immediately focused on whether Marvell could eventually become a trillion-dollar company.
Here was my question: Why was Huang making those comments in the first place?
Reviewing Marvell’s ownership structure, I discovered that Nvidia had finalized a strategic equity investment worth approximately $2 billion in the company earlier this year.
Coincidence? I think not!
This is exactly why insider and institutional ownership data can be so valuable.
Large strategic investments, insider purchases, and meaningful ownership changes often reveal long-term convictions that receive little attention from the financial media.
While investors focus on analyst ratings and earnings estimates, smart money is quietly positioning itself for opportunities that may take years to fully develop.
Our own Karim Rahemtulla spends considerable time tracking these types of transactions. In fact, he’s going live next week with a special training all about it.
Insider buying and selling, institutional accumulation, and strategic investments can provide valuable insight into how informed investors view a company’s future prospects.
No signal works all the time, but understanding where management teams and large institutions are deploying capital often provides context that the broader market overlooks.
The common thread between options activity and insider transactions is that both focus on actions rather than opinions.
Headlines tell investors what happened. Capital flows reveal where the smart money’s going.
Successful investing isn’t about reacting faster to the news. It’s about recognizing how capital is positioning itself before the news arrives.
Options activity can reveal where sophisticated traders are placing bets. Insider and institutional transactions can reveal where long-term conviction is developing.
The smart money rarely announces its intentions… but it does leave footprints for investors willing to follow the trail.