
Two years ago, Marvell (MRVL) had no custom silicon business.
Today it’s a $1.5 billion revenue line and growing.
Amazon’s Trainium chip and Microsoft’s Maia accelerator both run on Marvell silicon. Google is a customer too, and Marvell works directly with Nvidia on bandwidth and connectivity for AI data centers.
Its management expects the custom silicon revenue to at least double again by fiscal 2028. The company has 18 active design wins in production. Total data center revenue topped $6 billion in fiscal 2026, up 46% year over year, and the company guided fiscal 2027 revenue above $11 billion.
Wall Street has jumped on the bandwagon. 86% of the 50 analysts that cover the stock rate it a buy. Just this week, Bank of America raised its price target to $200.
And while the business is firing on all cylinders, but the thing I’m most excited about is what I see in the chart.
I’m all about the TPS, which stands for Trend, Pattern, and Squeeze. All elements are present in MRVL.
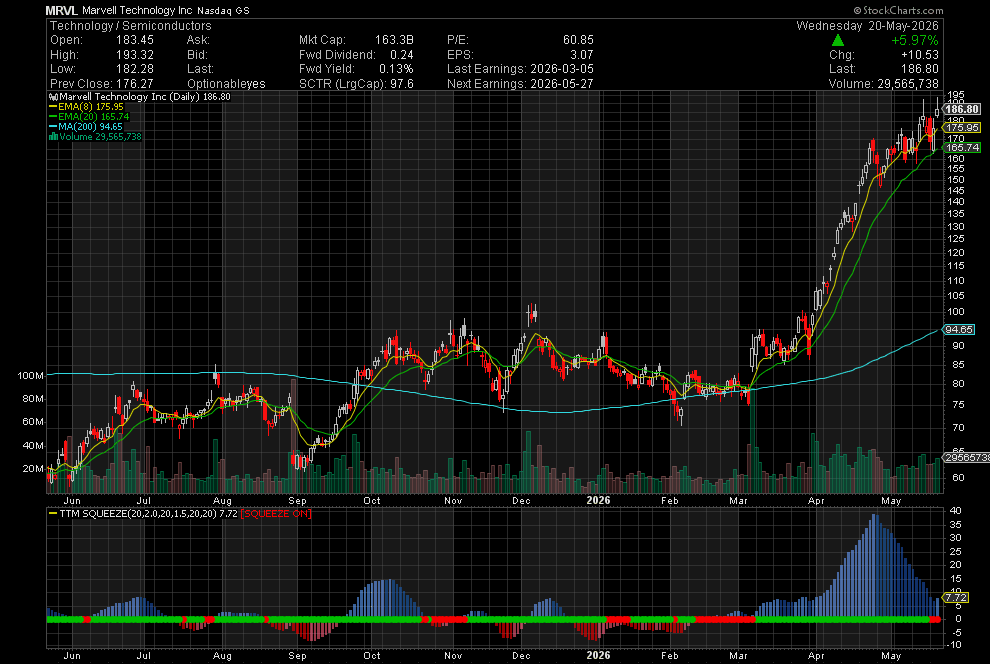
The moving averages tell the trend story. The 200-day moving average, which tracks the average closing price over the last 200 trading days, sits at $94.65. The 8-day and 20-day EMAs, which weight recent price action more heavily, are at $175.95 and $165.74, respectively.
At Wednesday’s close of $186.80, the price sat above all three, and all three are sloping up. That is the Trend box checked.
The TTM Squeeze is active on the daily chart right now. A squeeze happens when price compresses into a tight range, building pressure before a larger move. The pressure in MRVL is building to the upside. The Squeeze box checked.
The Pattern is the consolidation after the run. MRVL rallied from around $65 in late February to a 52-week high near $192, then pulled back and compressed into this range. On the weekly chart, the EMAs are stacked identically. That multi-timeframe alignment is the strongest version of this setup.
Your Action Plan
MRVL reports on May 27, one week away, and that creates two distinct ways to approach this trade.
The first is to play the runup. The AI trade is hot right now, and MRVL has the chart to back it up. So you could buy the stock now or even call options up until the earnings announcement, in hopes it runs up to the print.
The key would be to get out before the release, because even though the AI trade is hot right now, betting on direction on an earnings event is still a coin toss.
And while that trade could very well work. I’m more interested in the setup after it announces earnings.
If Marvell’s reaction to earnings is stronger than the market anticipates. I would like to be long it.
Last week, I went 24 for 25 playing exactly that pattern, entering after a strong earnings reaction and riding the continuation.
Decide which side of the earnings date fits your style.
If you want to find more setups like this one, join me in Daily Profits Live, where I share my watchlist, setups, and trade with you live.