BTC Rebounded To 64,864 – But Only The Hourly Believes It.
| | | |

BTC Rebounded To 64,864 – But Only The Hourly Believes It.

BTC Rebounded To 64,864 – But Only The Hourly Believes It. The shakeout call kept working. Bitcoin bounced from 62,452 all the way back to 64,864, up nearly a full percent, and is now pressing the 65,033 shelf it fell from. The hourly has flipped genuinely bullish – top-quartile conviction, a long thesis, entry partial….

# **BTC/USD 45-Minute Technical Analysis
| | | |

# **BTC/USD 45-Minute Technical Analysis

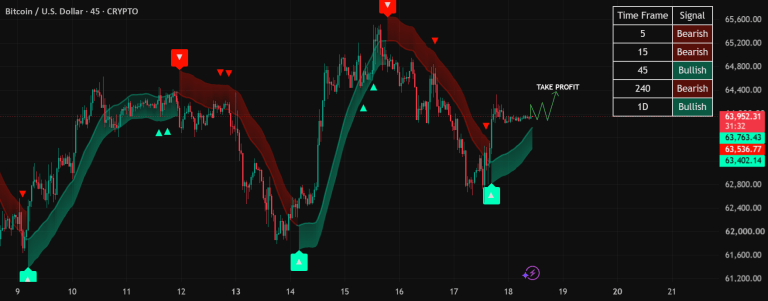
### **Market Overview** The BTC/USD 45-minute chart is showing a **short-term bullish structure** following a strong recovery from the recent swing low around **62,700**. Price has transitioned from a bearish trend into a higher-low formation, supported by a rising dynamic trend band (green cloud), indicating that buyers currently have the advantage. At the time of…

ETHEREUM: Bulls Test Critical Resistance
| | | |

ETHEREUM: Bulls Test Critical Resistance

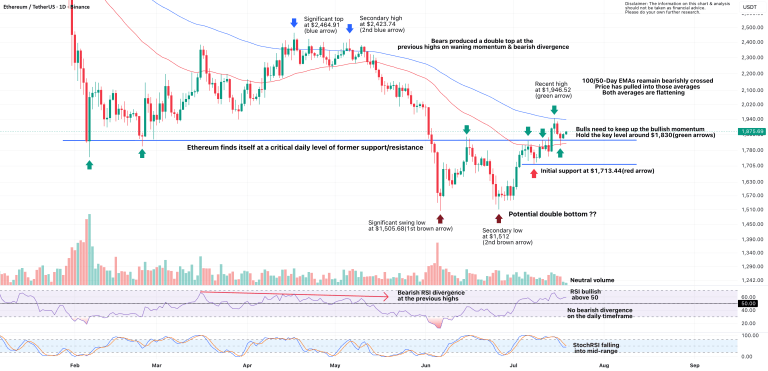
A Different Technical PictureEthereum has returned to the same major support/resistance zone that rejected price earlier this year, but this time the structure looks healthier. Unlike the previous test, there is no bearish RSI divergence and no clear double top, reducing the evidence of exhaustion. Resistance Still in PlayPrice has pushed into the flattening 100/50-day…

KSE-100: Is the Bull Market Over?
| | | |

KSE-100: Is the Bull Market Over?

Taking lead from our previous analysis, KSE-100 remains under pressure after failing to break above its previous ATH near 191K. Earlier this year, the index corrected from around 191K to 144K, a decline of approximately 24.6%. After forming a temporary bottom near 144K, the index recovered strongly and attempted to retest the ATH zone. However,…

TradeCityPro | Bitcoin Daily Analysis #334
| | | |

TradeCityPro | Bitcoin Daily Analysis #334

👋 Welcome to TradeCityPro!Let’s analyze Bitcoin. Today, the market may finally begin its next move. ⏳ 4H TimeframeThe weakness in the trend that we talked about yesterday is still visible in the market, and since it’s still the weekend, trading volume remains very low. ✔️ Today, as the New York session begins, price may finally…

GOLD MONTHLY LINE CHART INSIGHT
| | | |

GOLD MONTHLY LINE CHART INSIGHT

Gold (XAUUSD) Monthly Chart Logical Analysis @ ShavyfxhubBig-Picture Market Structure (1973 – 2026)This monthly chart gives an excellent top-down view of Gold’s long-term behavior.Key Observations:Gold has been in a multi-decade ascending channel (red trendlines) since the 1970s.The structure shows clear higher lows over time — classic long-term bullish market structure.Double Top formation in 1980–1981 (near…

Gold Weekly Outlook | ICT: Buy-side Raid Before Expansion?
| | | |

Gold Weekly Outlook | ICT: Buy-side Raid Before Expansion?

Gold enters the new trading week with sentiment supported by renewed geopolitical uncertainty after tensions between the U.S. and Iran intensified. Rising oil prices continue to fuel inflation concerns, while markets are also preparing for another week of Fed commentary and key U.S. economic releases. Although geopolitical risks support safe-haven demand, a resilient U.S. Dollar…

LLY: Buyers Return as Pullback Creates Entry Opportunity
| | | |

LLY: Buyers Return as Pullback Creates Entry Opportunity

LLY is beginning to attract renewed buying interest following its recent retracement. The stock remains in a strong uptrend, continuing to make higher highs and higher lows while trading above well-aligned 20 and 50-day moving averages, signaling that bullish momentum remains intact. Eli Lilly & Co. is a $1.11 trillion market capitalization company that engages…

BTC/USD | 45-Minute Timeframe
| | | |

BTC/USD | 45-Minute Timeframe

🟢 Overall Bias Neutral Bullish (Short-Term) | Mixed Multi-Timeframe The market has printed a strong bullish reversal after the sharp selloff around July 17. Buyers defended the lows aggressively, creating a higher low followed by an impulsive recovery. However, price is now approaching an important resistance zone where sellers previously entered. 📈 Multi-Timeframe SignalTimeframe Trend…

Ross Stores (ROST) Pullback Presents Buying Opportunity
| | | |

Ross Stores (ROST) Pullback Presents Buying Opportunity

ROST is attracting buying interest following its recent retracement. The stock remains in a strong uptrend, making higher highs and higher lows while trading above well-aligned 20 and 50-day moving averages, signaling continued bullish momentum. Ross Stores, Inc. is a $74.89 billion market capitalization company that operates off-price retail apparel and home accessories stores. Through…

End of content

End of content